SPSS Modelerの精度分析ノードと評価グラフノードをPythonで書き換えます。
0.データ
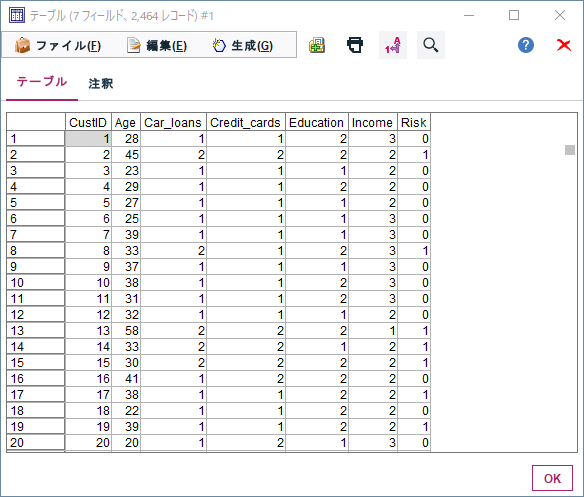
まず以下のようなデータを用いて決定木モデルを作ります。
目的変数
Risk:信用リスク
説明変数
Age:年齢
Income:収入ランク
Credit_cards:クレジットカード枚数
Education:学歴
Car_loans:車のローン数
年齢や収入ランクから信用リスクを判定する2値分類のモデルを評価します。
1m.①説明変数、目的変数の定義とモデルの作成 Modeler版
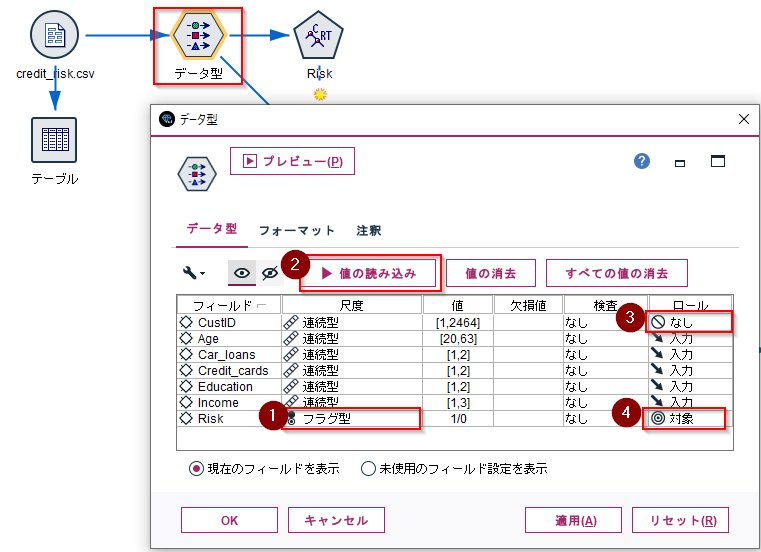
まず、データ型ノードで説明変数、目的変数の定義を行う必要があります。
Riskの尺度を「フラグ型」に変更し、「値の読み込み」ボタンをクリックします。その後、CustIDのロールを「なし」、Riskのロールを「対象」(目的変数の意味)を設定します。Age、Income、Credit_cards、Education、Car_loansは「入力」(説明変数の意味)のままにします。
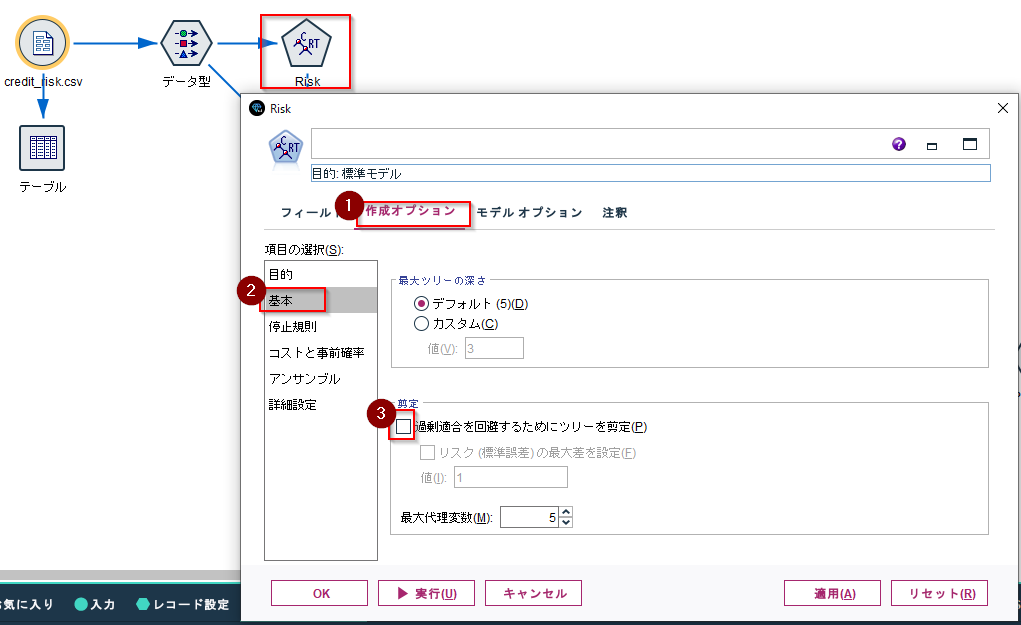
C&R Treeのモデル作成ノードを接続します。そのまま実行してもモデルは作成できるのですが、ここではDecisionTreeClassifierとなるべく似た設定にします。
まず、「作成オプション」タブ「基本」項目の「過剰適合を回避するためにツリーを剪定」のチェックを外します。
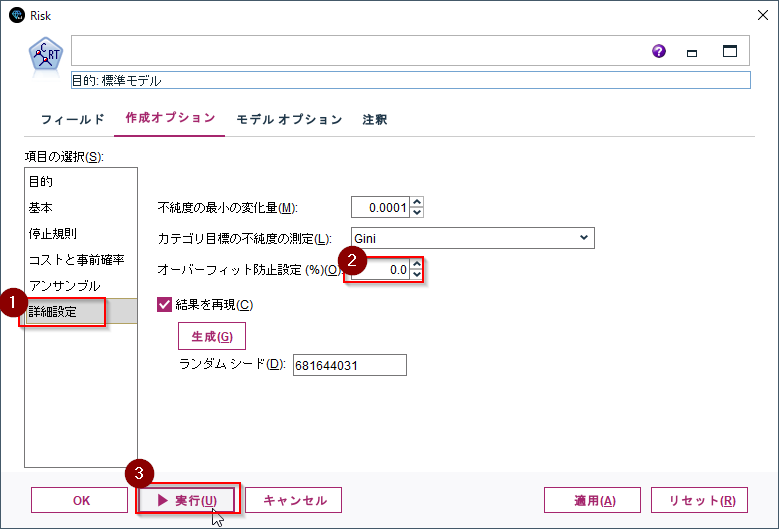
もうひとつ、詳細設定項目の「オーバーフィット防止設定」を0にし、実行します。
1p.①説明変数、目的変数の定義とモデルの作成 Sckit-Learn版
scikit-learnの場合、説明変数、目的変数の定義はXとyの変数に入力します。
# 説明変数と目的変数の定義
X  = df[['Age', 'Car_loans', 'Credit_cards', 'Education','Income']]
y =df['Risk']
Sckit-LearnのCARTモデルはDecisionTreeClassifierで作ります。
max_depthなどのパラメーターはModelerのデフォルト値に近いもので指定しました。
fit(X, y)で説明変数と目的変数を与えてモデルを作成します。
# Cartモデル作成のパッケージ
from sklearn.tree import DecisionTreeClassifier
# モデル作成
clf = DecisionTreeClassifier(max_depth=5,min_samples_split=0.02,min_samples_leaf=0.01,min_impurity_decrease=0.0001)
clf = clf.fit(X, y)
2m.②精度評価、混同行列、AUC Modeler版
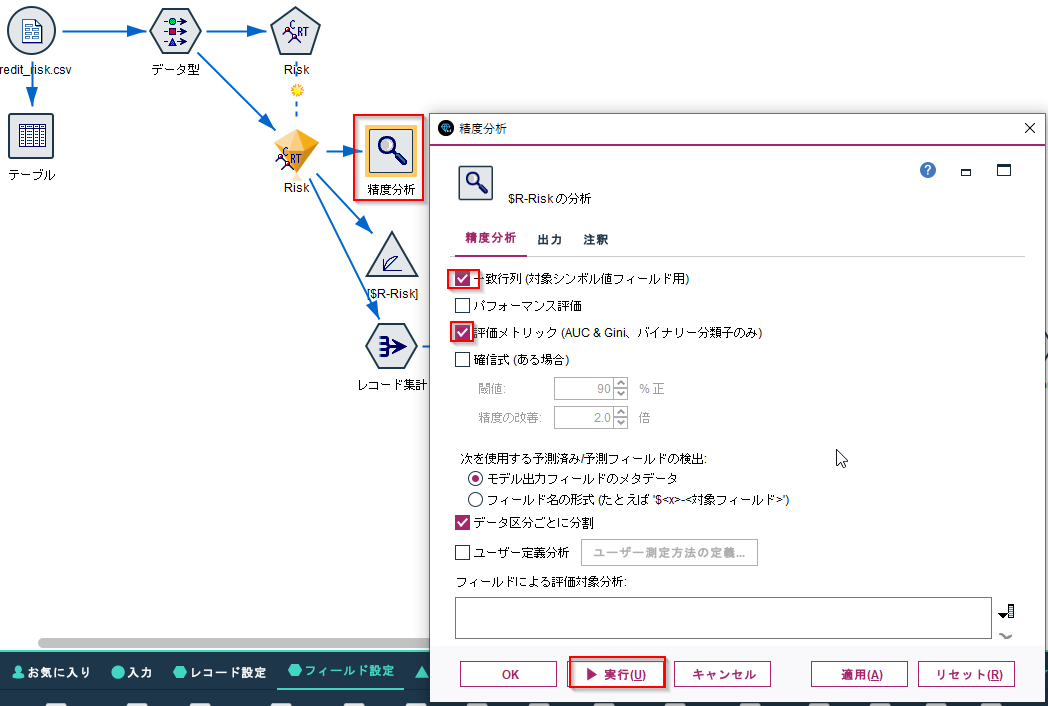
作成されたモデルナゲットに「精度分析ノード」をつなぎます。
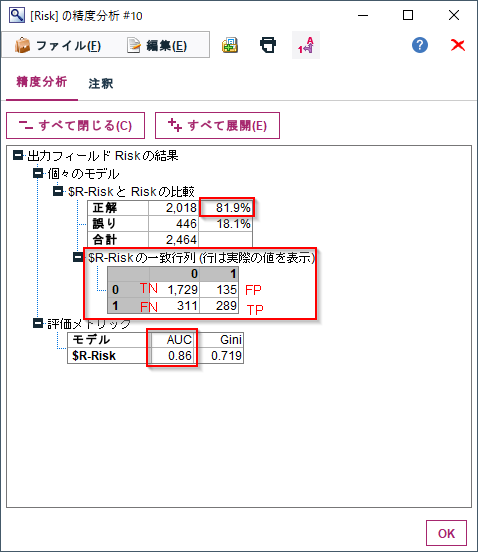
様々な評価指標がありますが、ここではよく使う一致行列と評価メトリックを選択し、実行します。一致行列は混同行列といった方がなじみがあるかもしれません。
正解にある%が精度(Accuracy)です。
一致行列が混同行列です。
評価メトリックのAUCがAUCです。
これらの評価指標を一度に計算できます。
2p.②精度評価、混同行列、AUC Sckit-Learn版
sckitlearnで精度を計算するのはaccuracy_scoreです。
引数には正解データのyと予測結果clf.predict(X)を与えます。
from sklearn.metrics import accuracy_score
y_pred=clf.predict(X)
print('accuracy_score:%f' % accuracy_score(y, y_pred))
accuracy_score:0.818994
混同行列はconfusion_matrixで計算します。
引数はaccuracy_scoreと同じ正解データと予測結果です。
from sklearn.metrics import confusion_matrix
cm = confusion_matrix(y, y_pred)
print(cm)
[[1729  135]
 [ 311  289]]
AUCはroc_auc_scoreで計算します。
引数には正解データのyとTrueの確信度であるclf.predict_proba(X)[:,1]を与えます。
from sklearn.metrics import roc_auc_score
y_score=clf.predict_proba(X)[:,1]
print('roc_auc_score:%f' % roc_auc_score(y, y_score))
roc_auc_score:0.862200
3m.③ROC曲線、ゲイングラフ Modeler版
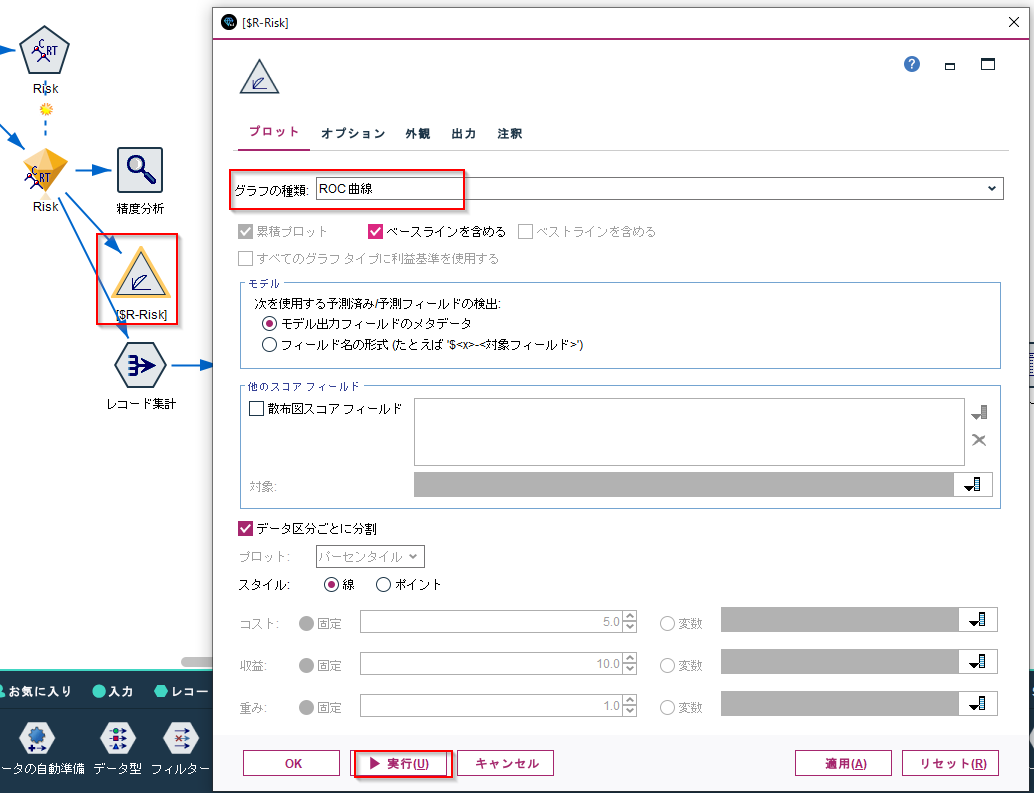
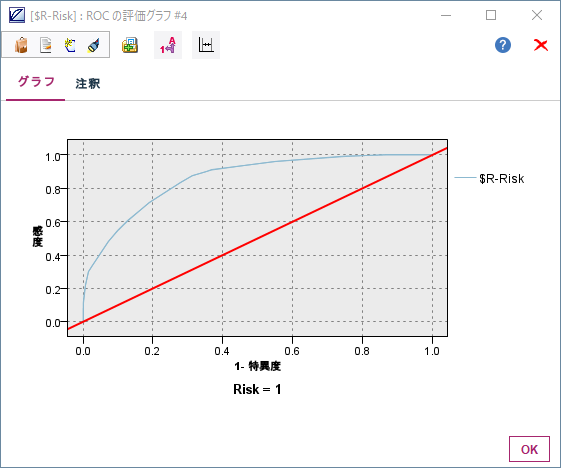
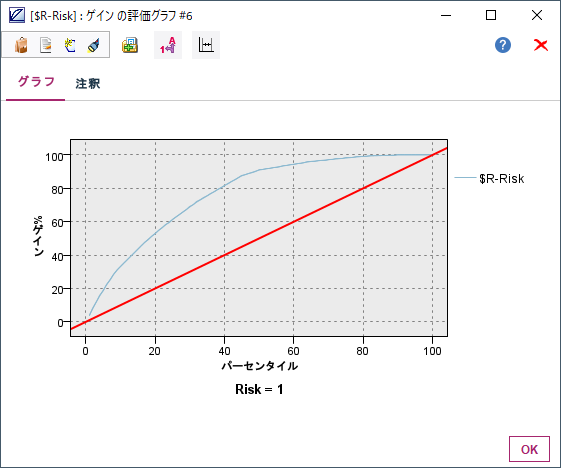
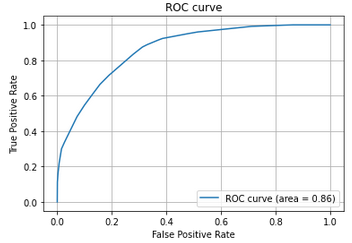
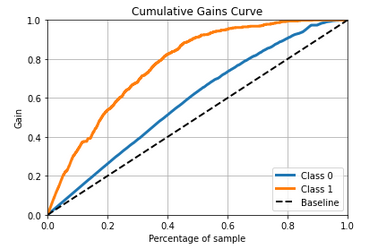
ROCの値だけでなく、ROC曲線やゲイングラフで評価をします。
「評価」のグラフノードをモデルナゲットに接続します。
グラフの種類をROCにし、実行して表示します。
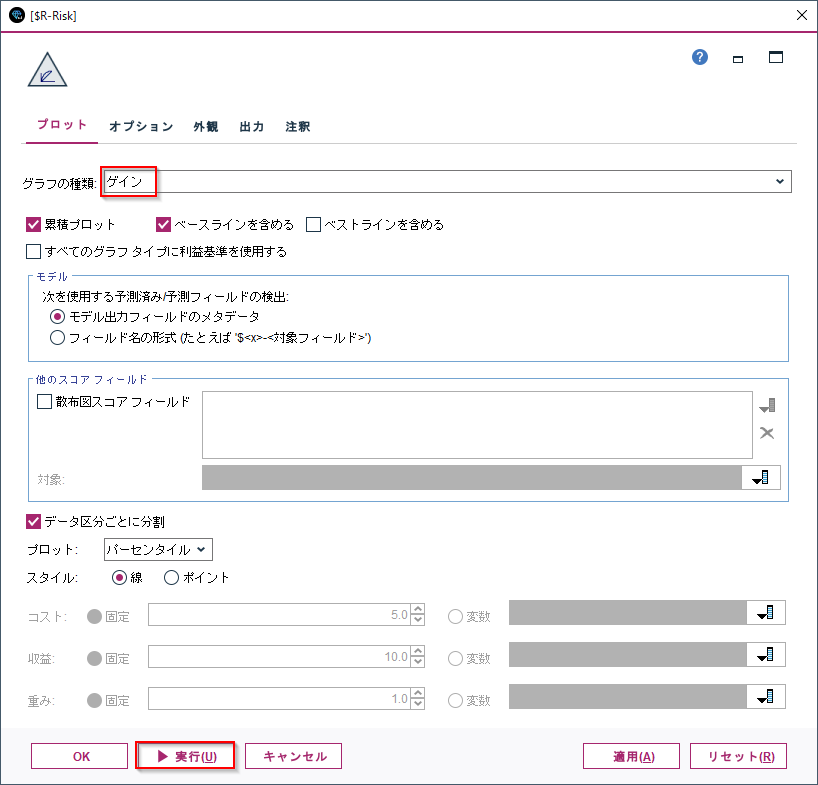
次にグラフの種類をゲインにして表示します。
3p.③ROC曲線、ゲイングラフ Sckit-Learn版
ROC曲線はroc_curveでFalse Positive RateとTrue Positive Rateを取得してプロットします。
引数には正解データのyとTrueの確信度を与えます。
from sklearn.metrics import roc_curve
from sklearn.metrics import auc
import matplotlib.pyplot as plt
fpr, tpr, thresholds = roc_curve(y, y_score)

auc = auc(fpr, tpr)

# ROC曲線をプロット
plt.plot(fpr, tpr, label='ROC curve (area = %.2f)'%auc)
plt.legend()
plt.title('ROC curve')
plt.xlabel('False Positive Rate')
plt.ylabel('True Positive Rate')
plt.grid(True)
以下の記事を参考にしました:ROC曲線とAUCの出力 - Qiita
ゲインのグラフについてはscikitplotのplot_cumulative_gainを使います。
引数には正解データのyとTrueとFalseの確信度を与えます。
import scikitplot as skplt
skplt.metrics.plot_cumulative_gain(y, clf.predict_proba(X)[:])
4m.④Precision,Recall,F1スコア Modeler版
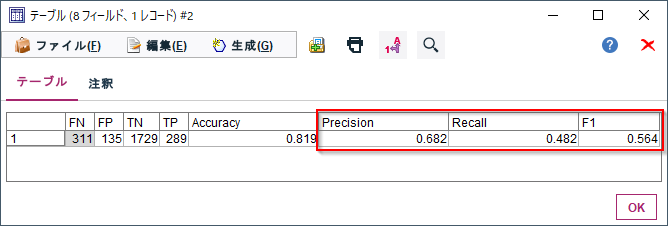
Modelerの「精度分析ノード」でAccuracyや混同行列はでるのですが、Precision,Recall,F1スコアを出したいこともよくあります。
以下の記事のように算出をすることができます。
Modelerデータ加工Tips#04-行列入替で適合率PrecisionやF1スコア・MCCを求める | IBM ソリューション ブログ
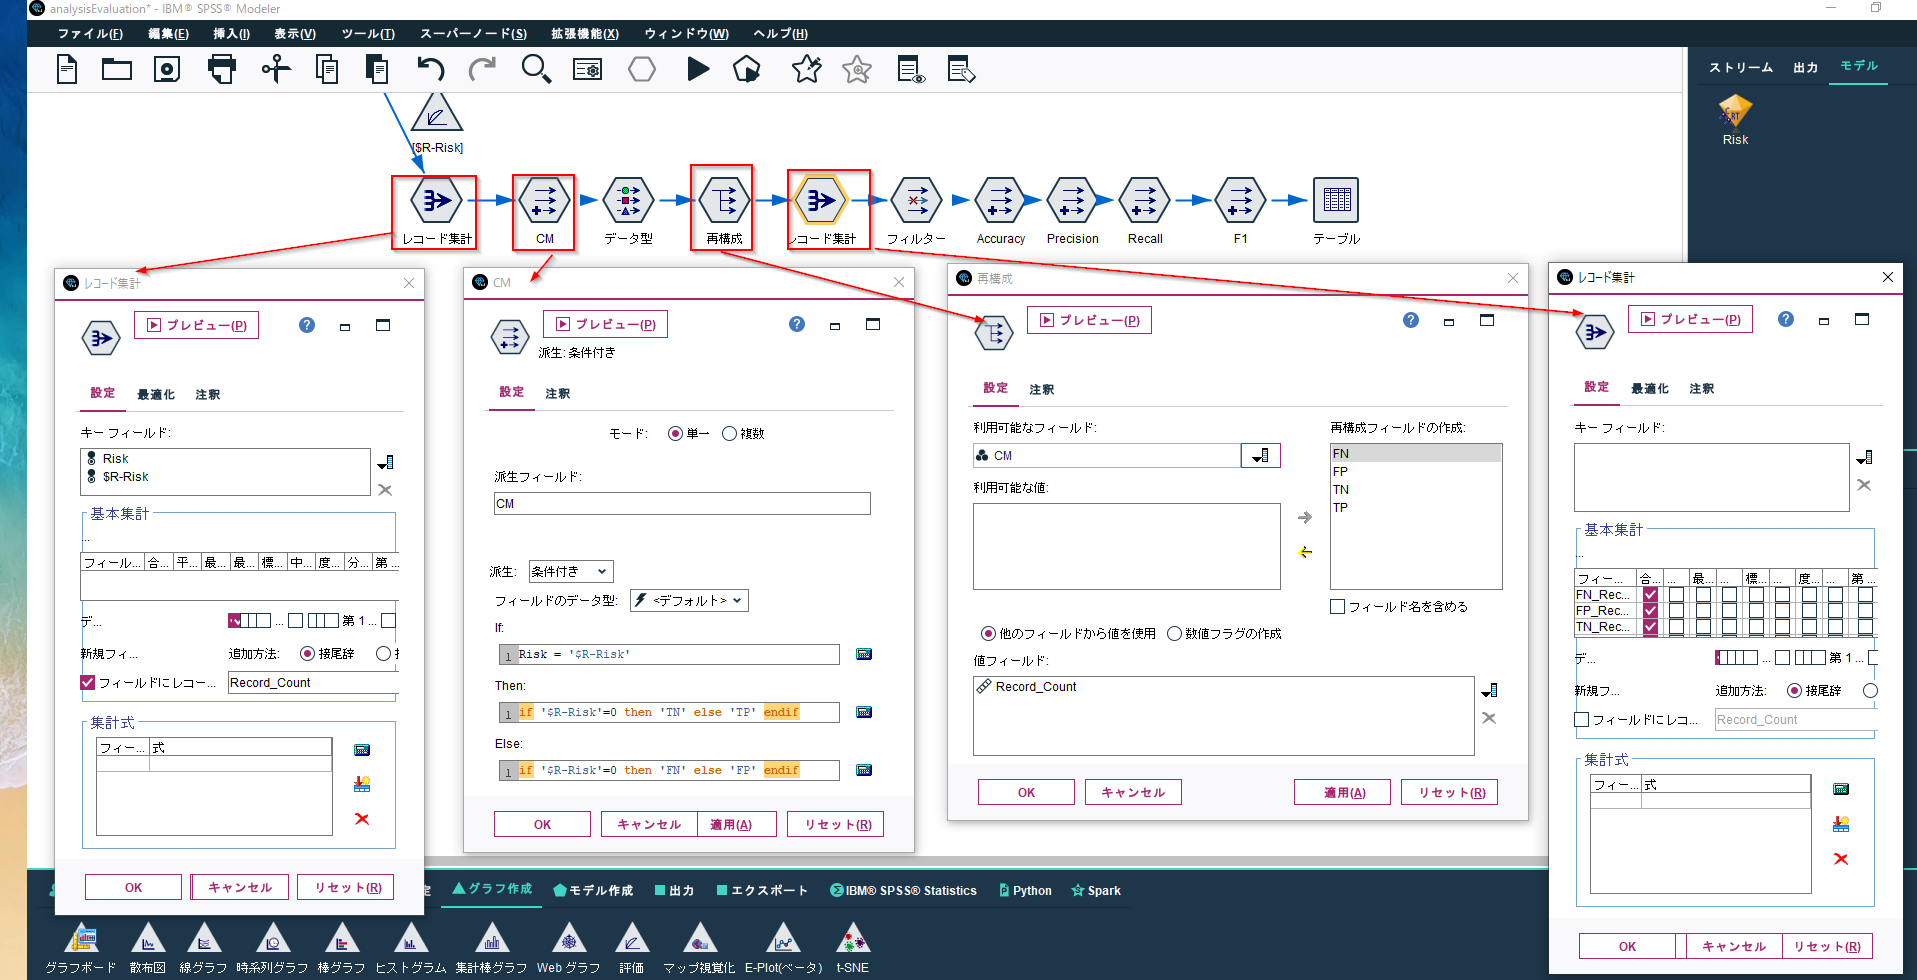
上のブログとちょっと違うのですが、ここでは以下のようなノードの組合せで混同行列のTP,TN,FP,FNを計算しています。
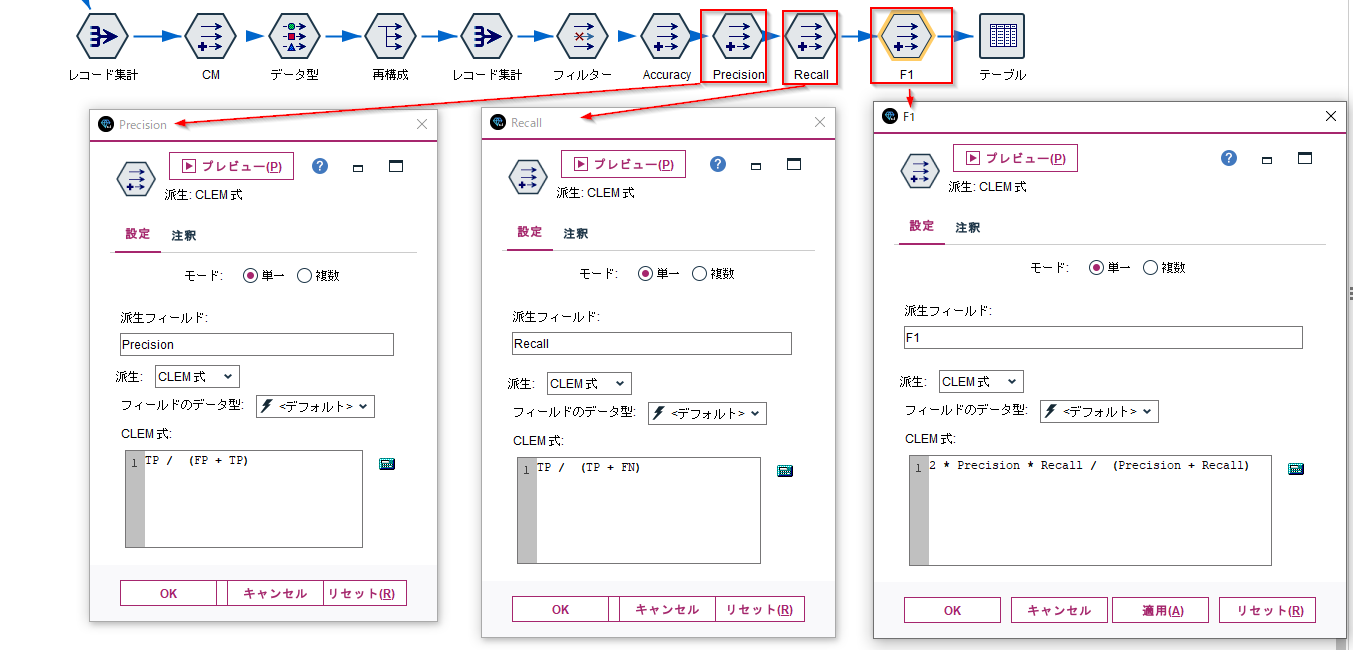
算出したTP,TN,FP,FNからPrecision,Recall,F1スコアを算出します。
4p.④Precision,Recall,F1スコア Sckit-Learn版
Accuracyと同様にPrecision,Recall,F1スコアは算出できます。
from sklearn.metrics import precision_score,recall_score,f1_score
print('precision_score:%f' % precision_score(y, y_pred))
print('recall_score:%f' % recall_score(y, y_pred))
print('f1_score:%f' % f1_score(y, y_pred))
precision_score:0.681604
recall_score:0.481667
f1_score:0.564453
いっぺんにレポートをするclassification_reportという命令もあります。
from sklearn.metrics import classification_report
print(classification_report(y, y_pred))
              precision    recall  f1-score   support

           0       0.85      0.93      0.89      1864
           1       0.68      0.48      0.56       600

    accuracy                           0.82      2464
   macro avg       0.76      0.70      0.73      2464
weighted avg       0.81      0.82      0.81      2464
5. サンプル
サンプルは以下に置きました。
ストリーム
https://github.com/hkwd/200611Modeler2Python/blob/master/AnalysisEvaluation/analysisEvaluation.str?raw=true
notebook
https://github.com/hkwd/200611Modeler2Python/blob/master/AnalysisEvaluation/analysisevaluation.ipynb
データ
https://raw.githubusercontent.com/hkwd/200611Modeler2Python/master/data/credit_risk.csv
■テスト環境
Modeler 18.3
Windows 10 64bit
Python 3.8.10
pandas 1.0.5
sklearn 0.23.2
scikitplot 0.3.7
6. 参考情報
精度分析ノード - IBM Documentation
モデル評価の結果の読み込み - IBM Documentation
sklearn-metrics-metrics API Reference — scikit-learn 1.0 documentation
scikit-learnで混同行列を生成、適合率・再現率・F1値などを算出 | note.nkmk.me
