SPSS Modelerの散布図ノードをPythonのmatplotlibやpandasのplotで書き換えてみます。
0.データ
サンプルで利用するデータは以下です
M_CD: マシンコード
UP_TIIME: 起動時間
POWER: 電力
TEMP: 温度
PRESSURE:圧力フラグ
ERR_CD: エラーコード
各マシンコードごとに起動時間にそって電力や温度の変化、圧力スイッチ、そしてエラーがあればそれが時系列に記録されています。
1m.散布図。Modeler版
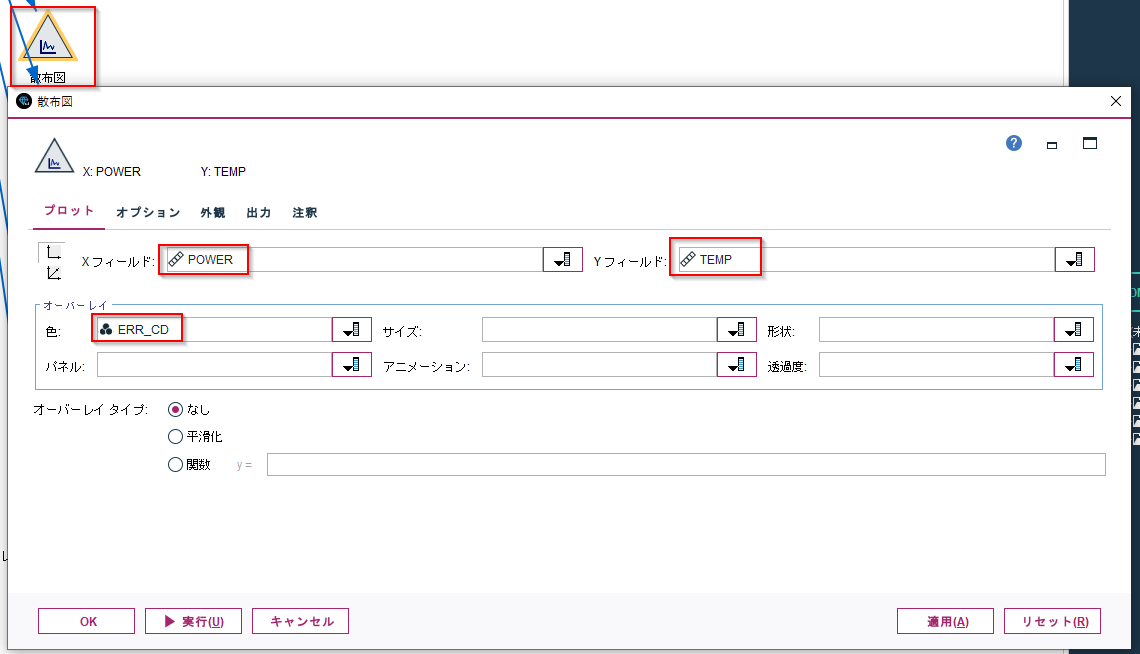
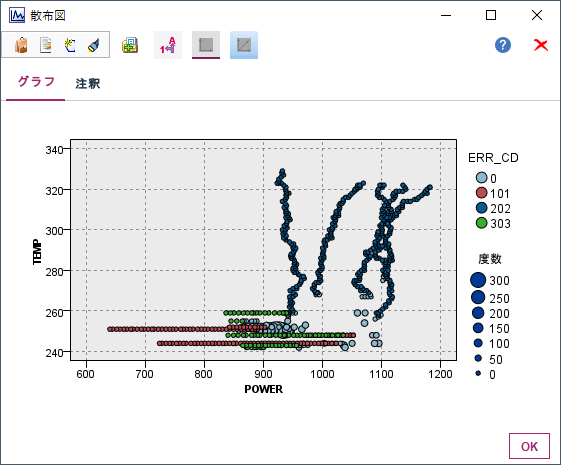
POWERとTEMPで散布図を作り、ERR_CDで色分けしてみます。
散布図ノードでxフィールドにPOWER、YフィールドにTEMP、オーバーレイの色にERR_CDを設定し、実行します。

1p.散布図。matplotlib,pandas版
matplotlibでERR_CDグ色分けした散布図を書くことは、1回のプロットでは行えません。各ERR_CDごとに別色の散布図のグラフをサブ・プロットでつくって、重ね合わせることになります。
plt.figure()で描画全体領域を確保し、fig.add_subplot(1,1,1)で描画領域を1つ追加します。
fig = plt.figure()
ax = fig.add_subplot(1,1,1)
- 参考: matplotlibの描画の基本 - figやらaxesやらがよくわからなくなった人向け - Qiita
次に色分けするERR_CDに対応した色をリストにしておきます。今回は4種類なので4つ用意しています。
colors=['cyan','red','blue','green']
そして、df['ERR_CD'].cat.categoriesでERR_CDの0,101,202,303でループさせ、df.queryをつかって、各ERR_CDで絞りこんだDataFrameオブジェクトを以下のように作ります。
df.query('ERR_CD=={0}'.format(err_cd))[['POWER','TEMP']]
そしてax.scatterで各ERR_CD毎の散布図を作ります。
for i,err_cd in enumerate(df['ERR_CD'].cat.categories):
    dfErrTmp=df.query('ERR_CD=={0}'.format(err_cd))[['POWER','TEMP']]
    ax.scatter(dfErrTmp['POWER'],dfErrTmp['TEMP'], c=colors[i], marker='.', label=str(err_cd))
ERR_CDが0,101,202,303の散布図を重ねてつくったらタイトルなどを設定してplt.show()で表示します。
ax.set_title('POWER v. TEMP')
ax.set_xlabel('POWER')
ax.set_ylabel('TEMP')
ax.grid(True)
ax.legend(loc='upper left')

plt.show()
かなり大変でした。
次はpandasのplotメソッドを使って同じことを行います。やはりERR_CDが0,101,202,303の散布図を重ねて作る必要があります。
dfErrTmpをつくるところまでは同じです。dfErrTmp.plot.scatterで散布図を書きます。
xとyにはDataFrameの列名であるPOWERとTEMPを指定します。
ax=axを指定することでサブプロットを重ねていくことができます。ただ、ERR_CD=0の時点ではaxが存在していないのでループが始まる前にax=Noneで初期化しておきます。
ax=None
for i,err_cd in enumerate(df['ERR_CD'].cat.categories):
    dfErrTmp=df.query('ERR_CD=={0}'.format(err_cd))[['POWER','TEMP']]
    ax=dfErrTmp.plot.scatter(x='POWER',y='TEMP', c=colors[i], marker='.'
                             ,grid=True, label=str(err_cd),ax=ax)
2. サンプル
サンプルは以下に置きました。
ストリーム
https://github.com/hkwd/200611Modeler2Python/blob/mastergraph/graph.str?raw=true
notebook
https://github.com/hkwd/200611Modeler2Python/blob/master/graph/graph.ipynb
データ
https://raw.githubusercontent.com/hkwd/200611Modeler2Python/master/data/Cond5n_e.csv
■テスト環境
Modeler 18.3
Windows 10 64bit
Python 3.8.5
pandas 1.0.5
3. 参考情報
散布図ノードのタブ - IBM Documentation


