netCDFファイルをpythonで描画
read_netCDF.py
import matplotlib as mp
import numpy as np
ind='hoge.grd'
Dat = np.netcdf(ind,'r').variables['z'][::-1]
lon=np.netcdf(ind,'r').variables['x'][::-1]
lat=np.netcdf(ind,'r').variables['y'][::-1]
NX, NY=np.meshgrid(lon, lat)
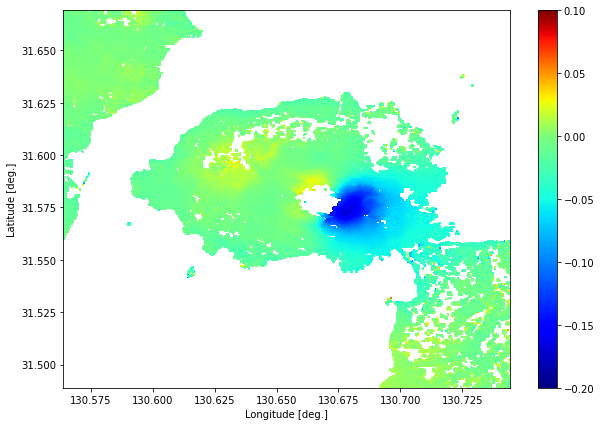
# カラーバーの最小,最大値指定しつつ,カラーバーの中心(z=0)の色は維持.
norm = mp.colors.TwoSlopeNorm(vcenter=0.0, vmin=-0.2, vmax=0.1)
# 2次元データの一部を切り抜き [pixel]
extX0=950
extX1=1600
extY0=1100
extY1=1750
# figure sizeも指定
fig=plt.figure(figsize=(10,10))
# colormapをjet
plt.pcolormesh(NX[extY0:extY1, extX0:extX1], NY[extY0:extY1, extX0:extX1], Dat[extY0:extY1, extX0:extX1], cmap='jet', norm=norm)
plt.colorbar() # カラーバーの表示
plt.xlabel('Longitude [deg.]')
plt.ylabel('Latitude [deg.]')
plt.show()
こんな感じの図が表示される↓