気象庁では概ね最大震度5弱以上の地震が発生すると震度観測と地盤状況などを考慮した推計震度分布を約1km格子で発表しています。
その推計震度分布をWebブラウザで表示したいので、比較的簡単にできるGeoJSONで出力したいと思います。
入手
推計震度分布の生データは普通無料では手に入りません。
素直にJMBSCから入手するか気象情報会社、持っている人に頼んで手に入れましょう。
仕様
推計震度分布はWMO(世界気象機関)によって仕様化されたBUFR形式をもとに作成されています。
バイナリデータなので、人では読めません。
詳しい仕様は気象庁が公開しているPDFをご覧下さい。
https://www.data.jma.go.jp/suishin/shiyou/pdf/no40102
電文の分割
推計震度分布で使われている仕様(一昔前)では1つの電文につき15KiB以下しか送信できません。
広い範囲で強い揺れを観測すると分割されて送られてますが、電文ヘッダーを取り除けばそのまま結合することで使うことができます。
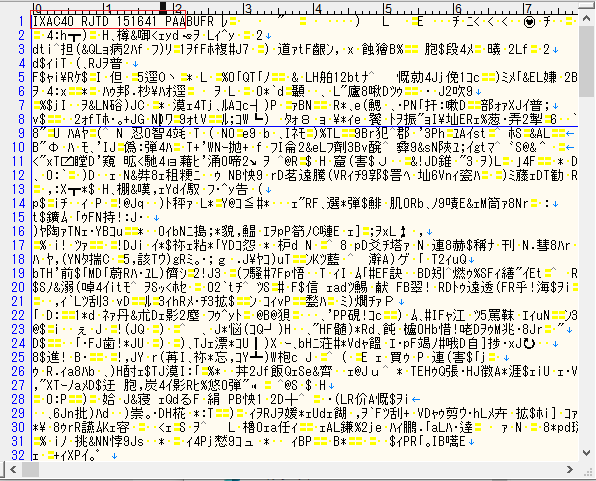
※実際の電文。赤枠が電文ヘッダーで、それ以降が本文となる。
電文ヘッダーとは何ぞやという人はコチラ
各節の説明
電文本文は各節に分かれていて、
第0節は、指示節(BUFRヘッダー)
第1節は、識別節(電文作成情報)
第2節は、省略されている
第3節は、資料記述節(震源要素や、格子系定義※実データは入っていない)
第4節は、資料表現節(実際の震源要素・推計震度分布)
第5節は、終端節
となっています。
推計震度分布の格納される方法
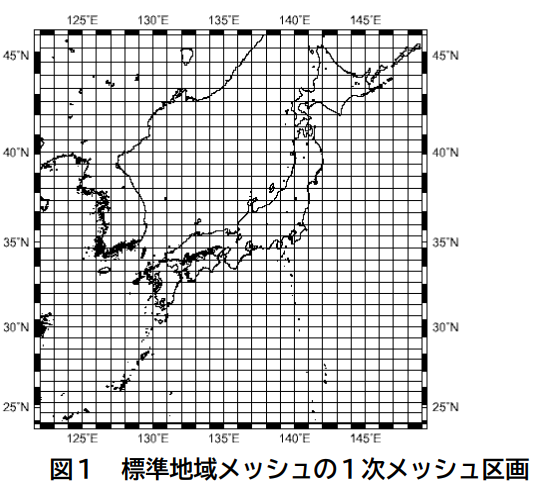
図1:技術情報より引用
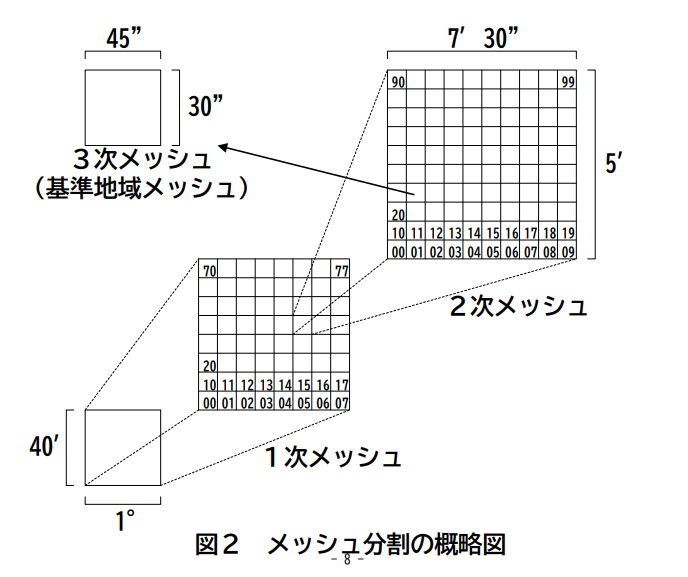
図2:技術情報より引用
現在、各格子は3次メッシュで表現され、3次メッシュが100個集まり、2次メッシュになり、それが64個集まることで1次メッシュを形成します。
読み込み・出力
今回、筆者が日常的に使うTypeScript >=3.7.0&Node.js >= 14.0.0で記述します。
※バージョンについてはちょっと古いやつでも動きます。
※第0節、第1節、第3節は今回は使わない
const dataBuffers: Buffer[] = []; // 生データ。分割されていなければ要素の数は1つ。

// 各電文に含まれる電文ヘッダーを取り除く(ヘッダー長は可変)
const data = Buffer.concat(
    dataBuffers
      .map(buffer => buffer.slice(18))
      .map(buffer => buffer.indexOf('P') === 1 ? buffer.slice(4) : buffer)
  );

// 最初のオクテットから積算で開始位置を調べる。
const section1Start = 8;
const section3Start = data.readUIntBE(section1Start , 3) + section1Start;
const section4Start = data.readUIntBE(section1End, 3) + section1End;
第4節の読み取り位置を取得するところまで来ました。
しかし、第4節はビット単位で情報が表現されているので、オクテットをまたいでいたりする情報を取得するのはちょっと大変です。
なのでちょっとしたクラスを作りました。
※今回、小数・負の符号は使わないので考慮しない。
export class BitReader {
    private buffer: Buffer;
    private skipReadingBit = 0;

    constructor(buffer: Buffer | ArrayBuffer | Uint8Array | SharedArrayBuffer) {
        this.buffer = Buffer.from(buffer);
    }

    // ビット開始位置から取りたい長さを取得する。
    read(start: number, length: number): number {
        const bitStart = start % 8;
        const bitLength = length;
        const byteStart = ~~(start / 8);
        const byteLength = -~(length / 8);

        const readByteLength = byteLength + (byteLength * 8 < bitStart + bitLength ? 1 : 0);
        const readBitLength = readByteLength * 8;

        const num = this.buffer.readUIntBE(byteStart, readByteLength);

        return (num & (2 ** (readBitLength - bitStart) - 1)) >>> (readBitLength - bitStart - bitLength);
    }

    // 前回読んだ場所を記憶して、そこからのビット位置で取得する。
    flyRead(start: number, length: number, addition = true): number {
        const num = this.read(this.skipReadingBit + start, length);

        if (addition) {
            this.skipReadingBit += length + start;
        }

        return num;
    }
}
このクラスを読み込み、第4節の部分で使います。
import { BitReader} from './bit-reader.ts';

const section4End = data.readUIntBE(section4Start, 3) + section4Start;
const section4 = new BitReader(data.slice(section4Start, section4End));

// 計測震度の表現を読み飛ばす位置を求める。
const sidEnd = section4.flyRead(32, 8) * 27;

// 通常時は「0」、テスト時は「1」となる。
const status = section4.flyRead(sidEnd, 7);

// 以下震源要素は参考のため掲載、今回は使わない。
const originTime = `${section4.flyRead(0, 12)}-` +
    `${section4.flyRead(0, 4)}`.padStart(2, '0') + '-' +
    `${section4.flyRead(0, 6)}`.padStart(2, '0') + 'T' +
    `${section4.flyRead(0, 5)}`.padStart(2, '0') + ':' +
    `${section4.flyRead(0, 6)}`.padStart(2, '0') + ':00Z';
const regionCode = section4.flyRead(0, 10);
// 詳細地域名の有無(〇〇沖の北西約〇〇kmの表現)
if (section4.flyRead(0, 7, false) === 50) {
    section4.flyRead(0, 46);
}
const location = [
    (section4.flyRead(0, 15) - 9000) / 1000, // 緯度
    (section4.flyRead(0, 16) - 18000) / 1000 // 経度
];
const depth = section4.flyRead(0, 14) / 1000;
const magnitude = section4.flyRead(0, 7) / 10; // 例外表現あり。
次は本題の格子情報の読み取りです。
GeoJSONでは矩形は表現できないのでポリゴンで描いていきますが、ポリゴン1つ1つづつ格納すると容量がとんでもないことになるので、隣り合った同じ震度の格子は結合するよう、polygon-clippingというライブラリを使います。
import { writeFileSync } from 'fs';
import polygonClipping from 'polygon-clipping';

// ポリゴン情報を格納するオブジェクト、震度3以下は来ない前提。
const polygons = new Map<string, [number, number][][]>([
    ['4', []], ['5-', []], ['5+', []], ['6-', []], ['6+', []], ['7', []]
  ]);

// 格子1つの大きさ
const addLatitude = 30 / 3600;
const addLongitude = 45 / 3600;

// 1次メッシュの数
const meshG1Length = section4.flyRead(0, 16);

// 1次メッシュと2次メッシュは同じ数格納されている。
for (let i = 0; i < meshG1Length; i++) {
    const meshG1Latitude = section4.flyRead(0, 7); // 1次メッシュの緯度番号。
    const meshG1Longitude = section4.flyRead(0, 7); // 1次メッシュの経度番号。
    const meshG2Latitude = section4.flyRead(0, 4); // 2次メッシュの緯度番号。
    const meshG2Longitude = section4.flyRead(0, 4); // 2次メッシュの経度番号。

    // 3次メッシュの数
    const meshG3Length = section4.flyRead(0, 8);

    for (let j = 0; j < meshG3Length; j++) {
        const meshG3Latitude = section4.flyRead(0, 4); // 3次メッシュの緯度番号。
        const meshG3Longitude = section4.flyRead(0, 4); // 3次メッシュの経度番号。
        const meshG3Intensity = intensityClass(section4.flyRead(0, 7)); // 計測震度を震度にする。

        // 各メッシュ番号から所定の計算式に基づいて緯度・経度の10進法に変換する。
        const latitude = 2 / 3 * meshG1Latitude + 2 / 3 * meshG2Latitude / 8 + 2 / 3 * meshG3Latitude / 80;
        const longitude = 100 + meshG1Longitude + meshG2Longitude / 8 + meshG3Longitude / 80;

        // ポリゴンを各震度の配列に追加する。
        polygons.get(meshG3Intensity)?.push([
            [longitude, latitude],
            [longitude, latitude + addLatitude],
            [longitude + addLongitude, latitude + addLatitude],
            [longitude + addLongitude, latitude],
            [longitude, latitude]
        ]);
    }
}

// ポリゴン情報をGeoJSONの構造に追加する。
const geoJsonFeatures = [...polygons].map(([intensity, polygon]) => ({
    type: 'Feature',
    properties: {
        name: 'intensity:' + intensity
    },
    geometry: {
        type: 'Polygon',
        // 1つ1つのポリゴンを結合する。
        coordinates: polygonClipping.union(polygon.map(p => [p])).flat()
    }
}));

// 任意の場所に出力。
writeFileSync('earthquake.geojson', JSON.stringify({
    type: 'FeatureCollection',
    features: geoJsonFeatures
}));

// 計測震度を震度に直す関数。
function intensityClass(int: number) {
  if (int >= 35 && int < 45) {
    return '4';
  } else if (int >= 45 && int < 50) {
    return '5-';
  } else if (int >= 50 && int < 55) {
    return '5+';
  } else if (int >= 55 && int < 60) {
    return '6-';
  } else if (int >= 60 && int < 65) {
    return '6+';
  } else if (int >= 65) {
    return '7';
  }

  return '-';
}
これで完成です。
内容やPCスペックによりますが1秒以内には終わります。
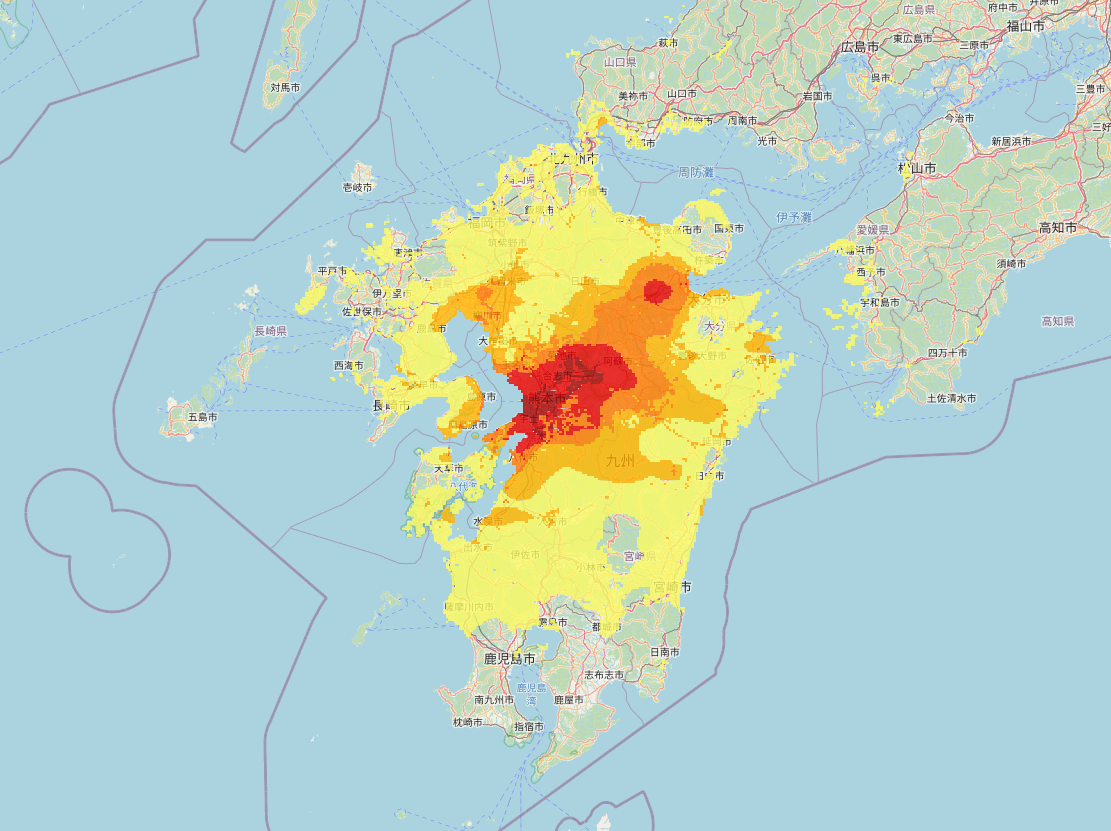
※2016年04月16日01時41分ごろの例
終わりに
ほとんど需要がないでしょうが書いてみました。いかがでしょうか。
現在気象庁では約1km格子から約250m格子への高度化を進めています。令和4年度より開始の予定だそうです。