swimlaneのngx-graphとは
Angularで使用できる、フローチャートを表示するライブラリです。
デモサイトを見るとイメージがつくと思います。
前提事項
2018年4月時点ではAngular5で使用可能です。
準備
###1. インストール
インストールのガイドに沿って、インストールします。
###2. systemjsの設定追加
以下の各種ライブラリの設定追加を行います。
systemjs.config.js
'@swimlane/ngx-charts':'npm:@swimlane/ngx-charts/release/index.js',
'@swimlane/ngx-graph':'npm:@swimlane/ngx-graph/release/index.js',
'@angular/animations':'npm:@angular/animations/bundles/animations.umd.min.js',
'@angular/animations/browser': 'npm:@angular/animations/bundles/animations-browser.umd.js',
'@angular/platform-browser/animations':'npm:@angular/platform-browser/bundles/platform-browser-animations.umd.js',
'd3-array': 'npm:d3-array/build/d3-array.min.js',
'd3-brush': 'npm:d3-brush/build/d3-brush.min.js',
'd3-color': 'npm:d3-color/build/d3-color.min.js',
'd3-collection': 'npm:d3-collection/build/d3-collection.min.js',
'd3-dispatch': 'npm:d3-dispatch/build/d3-dispatch.min.js',
'd3-drag': 'npm:d3-drag/build/d3-drag.min.js',
'd3-ease': 'npm:d3-ease/build/d3-ease.min.js',
'd3-force': 'npm:d3-force/build/d3-force.min.js',
'd3-format': 'npm:d3-format/build/d3-format.min.js',
'd3-hierarchy': 'npm:d3-hierarchy/build/d3-hierarchy.min.js',
'd3-interpolate': 'npm:d3-interpolate/build/d3-interpolate.min.js',
'd3-path': 'npm:d3-path/build/d3-path.min.js',
'd3-quadtree': 'npm:d3-quadtree/build/d3-quadtree.min.js',
'd3-scale': 'npm:d3-scale/build/d3-scale.min.js',
'd3-selection': 'npm:d3-selection/dist/d3-selection.min.js',
'd3-shape': 'npm:d3-shape/build/d3-shape.min.js',
'd3-time-format': 'npm:d3-time-format/build/d3-time-format.min.js',
'd3-time': 'npm:d3-time/build/d3-time.min.js',
'd3-timer': 'npm:d3-timer/build/d3-timer.min.js',
'd3-transition': 'npm:d3-transition/build/d3-transition.min.js',
###3. module.tsでのimport
下記の通り使用するコンポーネントのmoduleでimportを行います。
test.module.ts
import { NgModule }      from '@angular/core';
import { CommonModule } from '@angular/common';
import { FormsModule } from '@angular/forms';
import { BrowserAnimationsModule } from '@angular/platform-browser/animations';
import { NgxChartsModule } from '@swimlane/ngx-charts';
import { NgxGraphModule } from '@swimlane/ngx-graph';

@NgModule({
  imports:[ CommonModule ,FormsModule , BrowserAnimationsModule , NgxChartsModule, NgxGraphModule]
})
export class TestModule { }
使用方法
デモサイトのソースはgithubにあげられているので、これを参考に実装します。
これをもとに、当方でシンプルに実装したサンプルを下記に記します。
test.component.ts
import { Component , OnInit} from '@angular/core';
import * as shape from 'd3-shape';
@Component({
template: `
<!-- グラフ表示 -->
<ngx-graph
#graph
class="chart-container"
[view]="view"
[enableZoom]="enableZoom"
[autoZoom]="autoZoom"
[panOnZoom]="panOnZoom"
[panOffsetX]="panOffsetX"
[panOffsetY]="panOffsetY"
[zoomLevel]="zoomLevel"
[legend]="showLegend"
[links]="hierarchialGraph.links"
[nodes]="hierarchialGraph.nodes"
[scheme]="colorScheme"
[orientation]="orientation"
[curve]="curve"
(select)="select($event)">
<!-- Linkの矢印の定義 -->
<ng-template #defsTemplate>
<svg:marker id="arrow" viewBox="0 -5 10 10" refX="8" refY="0" markerWidth="4" markerHeight="4" orient="auto">
<svg:path d="M0,-5L10,0L0,5" class="arrow-head" />
</svg:marker>
</ng-template>
<!-- nodeの定義 -->
<ng-template #nodeTemplate let-node>
<svg:g class="node"
ngx-tooltip
[tooltipPlacement]="'top'"
[tooltipType]="'tooltip'"
[tooltipTitle]="node.label">
<svg:rect [attr.width]="node.width" [attr.height]="node.height" [attr.fill]="node.options.color" />
<svg:text alignment-baseline="central" [attr.x]="10" [attr.y]="node.height / 2">{{node.label}}</svg:text>
</svg:g>
</ng-template>
<!-- Linkの定義 -->
<ng-template #linkTemplate let-link>
<svg:g class="edge">
<svg:path
class="line"
stroke-width="2"
marker-end="url(#arrow)" >
</svg:path>
<svg:text class="edge-label" text-anchor="middle">
<textPath
class="text-path"
[attr.href]="'#' + link.id"
[style.dominant-baseline]="link.dominantBaseline"
startOffset="50%">
{{link.label}}
</textPath>
</svg:text>
</svg:g>
</ng-template>
</ngx-graph>
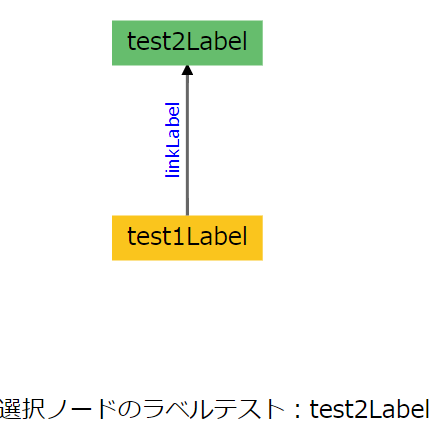
<!-- node選択テスト -->
選択ノードのラベルテスト:{{selectedNodeTestLabel}}
`,
styleUrls: ['./CSS/test.component.css']
})
export class TestComponent {
// グラフの設定
// グラフのデータ
hierarchialGraph: { links: any[], nodes: any[] };
// グラフのリンク配列
links: any[];
// グラフのnode配列
nodes: any[];
// viewの配列(横と縦をセット)
view: any[];
// viewの横幅
width: number = 300;
// viewの縦幅
height: number = 300;
// ズーム可能か
enableZoom: boolean = true;
// 自動ズーム
autoZoom: boolean = false;
// ズーム状態にするか
panOnZoom: boolean = false;
// x座標の位置
panOffsetX: number = 100;
// y座標の位置
panOffsetY: number = 100;
// zoomをどれだけにするか
zoom: number = 0.7;
// 凡例表示
showLegend: boolean = false;
// 色合い
colorScheme: any;
// グラフの向き
orientation: string = 'BT';
// 線のタイプ
curve: any = shape.curveLinear;
// node選択テスト
selectedNodeTestLabel: string;
ngOnInit(){
// グラフのviewをセット
this.view = [this.width, this.height];
// グラフの色合いのセット(picnic)
this.colorScheme = {
name: 'picnic',
selectable: false,
group: 'Ordinal',
domain: [
'#FAC51D', '#66BD6D', '#FAA026', '#29BB9C', '#E96B56', '#55ACD2', '#B7332F', '#2C83C9', '#9166B8', '#92E7E8'
]
};
// グラフのテスト用のグラフデータ
this.links = [{source: 'test1', target: 'test2', label: 'linkLabel'}];
this.nodes = [{id: 'test1', label: 'test1Label'},
{id: 'test2', label: 'test2Label'}
];
this.hierarchialGraph = {links:this.links, nodes:this.nodes};
}
// グラフのノードがクリックされたとき
select(node:any) {
// テスト用のラベル表示
this.selectedNodeTestLabel = node.label;
}
test.component.css
.text-path{
  fill: blue;

}
動作すれば下記のようにグラフが表示されます。