概要
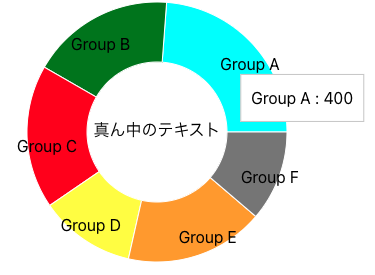
グラフを描画できるライブラリRechartsの機能で、いわゆる円グラフを生成できるのがPieChartです。PieChartでラベルを付与したり、データごとに色を変えたりしてみましたのでそのメモ書きです。完成イメージは以下のような感じです。
前提
- 使用したRechartsのバージョンは
2.13.3です。
対応方針など
- データごとのラベルを付与したり色を変えたりする実装はPieChartWithCustomizedLabelが参考になります。色は
Cellのタグを設定し、ラベルの設定はlabelプロパティにrenderの関数を設定することで実現できます。 - 真ん中にテキストを入れる実装はLabel in center of PieChartのissueが参考になります。
textタグを別途設定して、真ん中に来るように位置調整します。真ん中を空洞にするにはinnerRadiusを設定します。
実装サンプル
以下が実装のサンプルです。
sample.tsx
import { Cell, Pie, PieChart, Tooltip } from "recharts";

const data01 = [
  {
    name: "Group A",
    value: 400,
    color: "aqua",
  },
  {
    name: "Group B",
    value: 300,
    color: "green",
  },
  {
    name: "Group C",
    value: 300,
    color: "red",
  },
  {
    name: "Group D",
    value: 200,
    color: "yellow",
  },
  {
    name: "Group E",
    value: 290,
    color: "orange",
  },
  {
    name: "Group F",
    value: 189,
    color: "gray",
  },
];

type PiChartsLabelType = {
  cx: number;
  cy: number;
  midAngle: number;
  innerRadius: number;
  outerRadius: number;
  percent: number;
  index: number;
};

const RADIAN = Math.PI / 180;

export default function Home() {
  const renderCustomizedLabel = ({
    cx,
    cy,
    midAngle,
    innerRadius,
    outerRadius,
    percent,
    index,
  }: PiChartsLabelType) => {
    // データのラベルを表示する箇所を位置調整する
    const radius = innerRadius + (outerRadius - innerRadius) * 0.5;
    const x = cx + radius * Math.cos(-midAngle * RADIAN);
    const y = cy + radius * Math.sin(-midAngle * RADIAN);

    return (
      <text
        x={x < cx ? x + 20 : x - 10}
        y={y < cy ? y : y + 10}
        fill="black"
        textAnchor={x > cx ? "start" : "end"}
        dominantBaseline="central"
      >
        {data01[index].name}
      </text>
    );
  };

  return (
    <div>
      <PieChart width={900} height={300}>
        <Pie
          data={data01}
          cx="50%"
          cy="50%"
          dataKey="value"
          outerRadius={130}
          innerRadius={70}
          labelLine={false}
          label={renderCustomizedLabel}
        >
          {data01.map((entry, index) => (
            <Cell key={`cell-${index}`} fill={entry.color} />
          ))}
        </Pie>
        <text x={450} y={150} textAnchor="middle" dominantBaseline="middle">
          真ん中のテキスト
        </text>
        <Tooltip />
      </PieChart>
    </div>
  );
}
