やりたいこと
scikit-learnで重回帰分析をしてみて使い方の流れを残す。
順序
- ライブラリのインポート
- データの読み込み
- データを標準化する
- モデルを作成
- モデルを確認
ライブラリのインポート
sklearnのlinear_modelモジュールのLinearRegressionをインポートする。
import numpy as np
import pandas as pd
import matplotlib.pyplot as plt
import seaborn as sns
sns.set()
from sklearn.linear_model import LinearRegression
from sklearn.preprocessing import StandardScaler
データの読み込み
今回はUdemyの講座【世界で55万人が受講】データサイエンティストを目指すあなたへ〜データサイエンス25時間ブートキャンプ〜で使用したSATスコアとGPAのデータを用いて記事を作成しました。
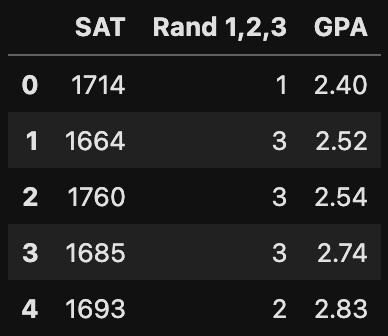
data = pd.read_csv('1.02.Multiple-linear-regression.csv')
data.head()
SATスコアとRand1,2,3(ランダムな1〜3の数)からGPAスコアを算出してみます。

データを標準化する
x = data[['SAT','Rand 1,2,3']]
y = data['GPA']
# ------ここから標準化------
scaler = StandardScaler()
scaler.fit(x)
x_scaled = scaler.transform(x)
モデルを作成
xに説明変数を代入、yに目的変数を代入する。
LinearRegressionで線形モデルを定義しておき.fit()メソッドで実行する。
reg = LinearRegression()
reg.fit(x_scaled,y)
モデルを確認
print(reg.coef_)  # k係数を確認
print(reg.intercept_) # 切片を確認
print(reg.score(x,y)) # 決定係数を確認
array([ 0.00165354, -0.00826982])
0.29603261264909353
0.4066811952814285