概要
- PyCaretでPCAを行いました。(ハイパーパラメータ等の最適化はしていません)
- とある電力量データでPCAを行いました。
ソースコード
- 自前のデータ整形ソースコード(汚い):13行
自前のデータ整形コード
import pandas as pd
def load_sampledata():
    data = pd.read_csv(r'pycaret_sample.csv',
            encoding='shift-jis',
            engine='python',
            index_col=[0],
            parse_dates=[0])

    data = data.resample('h').sum()
    data['hour'] = data.index.hour
    data['date'] = data.index.strftime('%Y-%m-%d (%a)')
    dataset = data.pivot(index='hour',columns='date',values='電力量')
    dataset = dataset.T.reset_index()
    return dataset
- PyCaretのセットアップ:2行
setup
from pycaret.clustering import *
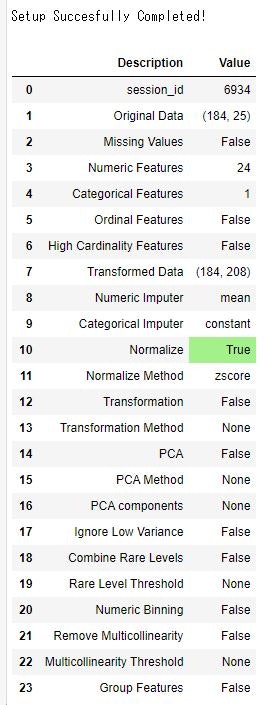
clu = setup(data = load_sampledata(),normalize=True)
-
setupした内容を確認できる
-
PyCaretのモデル作成+プロット作成:2行
create_model&plot
# creating a model
hclust = create_model('hclust')
# plotting a model
plot_model(hclust,plot='cluster',feature='date')
- 2行でPCAと可視化までできる。
まとめ
- PyCaretすごい。
- これで書き始めるとラッパーなしで書けなくなりそう。
- チューニングもできるし、すごい早さで書ける。すごい。