概要
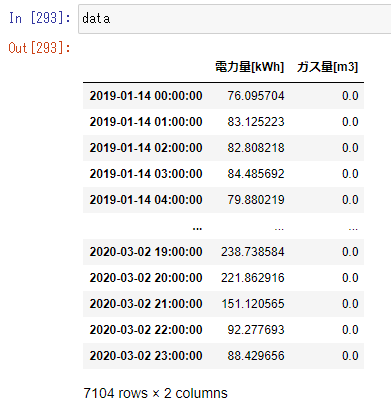
- エネルギーデータのカレンダー状のヒートマップを作りたかった。
- calmapがあるけど、pandas1.0以上に対応していないっぽい。(ixつかってる?)
- せっかくだからplotlyで作ってみた。(hovertextとかおしゃれだし・・・)
実装
gen_calmap
def gen_calmap(df,column_name_lst,aggr='sum',height= 260,width = 900):
    try:
        for column_name in column_name_lst:

            # heatmap_df_lst生成
            heatmap_df_lst = _calender_heatmap_df(df,column_name,aggr)

            for heatmap_df in heatmap_df_lst:
                fig = px.imshow(heatmap_df[0],
                                x=heatmap_df[0].columns.unique(),
                                y=heatmap_df[0].index.unique(),
                                labels={'y':'Weekday','x':'Week','color':column_name},
                                width=width,
                                height=height,
                                aspect='auto',
                                )

                # セル間に隙間を入れる
                fig.data[0]['ygap']=1
                fig.data[0]['xgap']=1

                fig.update_traces(
                    text = heatmap_df[1],
                    hovertemplate="Date: %{text} <br>Week: %{x} <br>Weekday: %{y} <br> "+ column_name +": %{z}"
                )
                fig.show()
    except:
        print('calmapの生成に失敗しました。')

def _calender_heatmap_df(df,column_name,aggr='sum'):
    heatmap_df_lst =[]

    # DataFrame再生成
    data = pd.DataFrame(eval("df[column_name].resample('D').{}()".format(aggr)))
    data.index = pd.to_datetime(data.index)

    ## add data
    data['week'] = pd.to_datetime(data.index).strftime('Week:%W')
    data['weekday'] = pd.to_datetime(data.index).weekday
    data['date'] = pd.to_datetime(data.index).strftime('%Y/%m/%d')

    weekday_dic = {0:'Mon',1:'Tue',2:'Wed',3:'Thr',4:'Fri',5:'Sat',6:'Sun'}

    # データの展開
    for year in data.index.year.unique():
        # heatmap生成
        heatmap_df = data.loc[data.index.year == year,:].pivot_table(index='weekday',columns='week',values=column_name)

        # 曜日を月曜日→日曜日の順番に並べ替える
        heatmap_df = heatmap_df.rename(index=weekday_dic)

        # 日付dfを生成
        date_df = data.loc[data.index.year == year,:].pivot(index='weekday',columns='week',values='date')
        date_df = date_df.rename(index=weekday_dic)

        # dfをリストに加える
        heatmap_df_lst.append([heatmap_df,np.array(date_df)])

    return heatmap_df_lst
実行
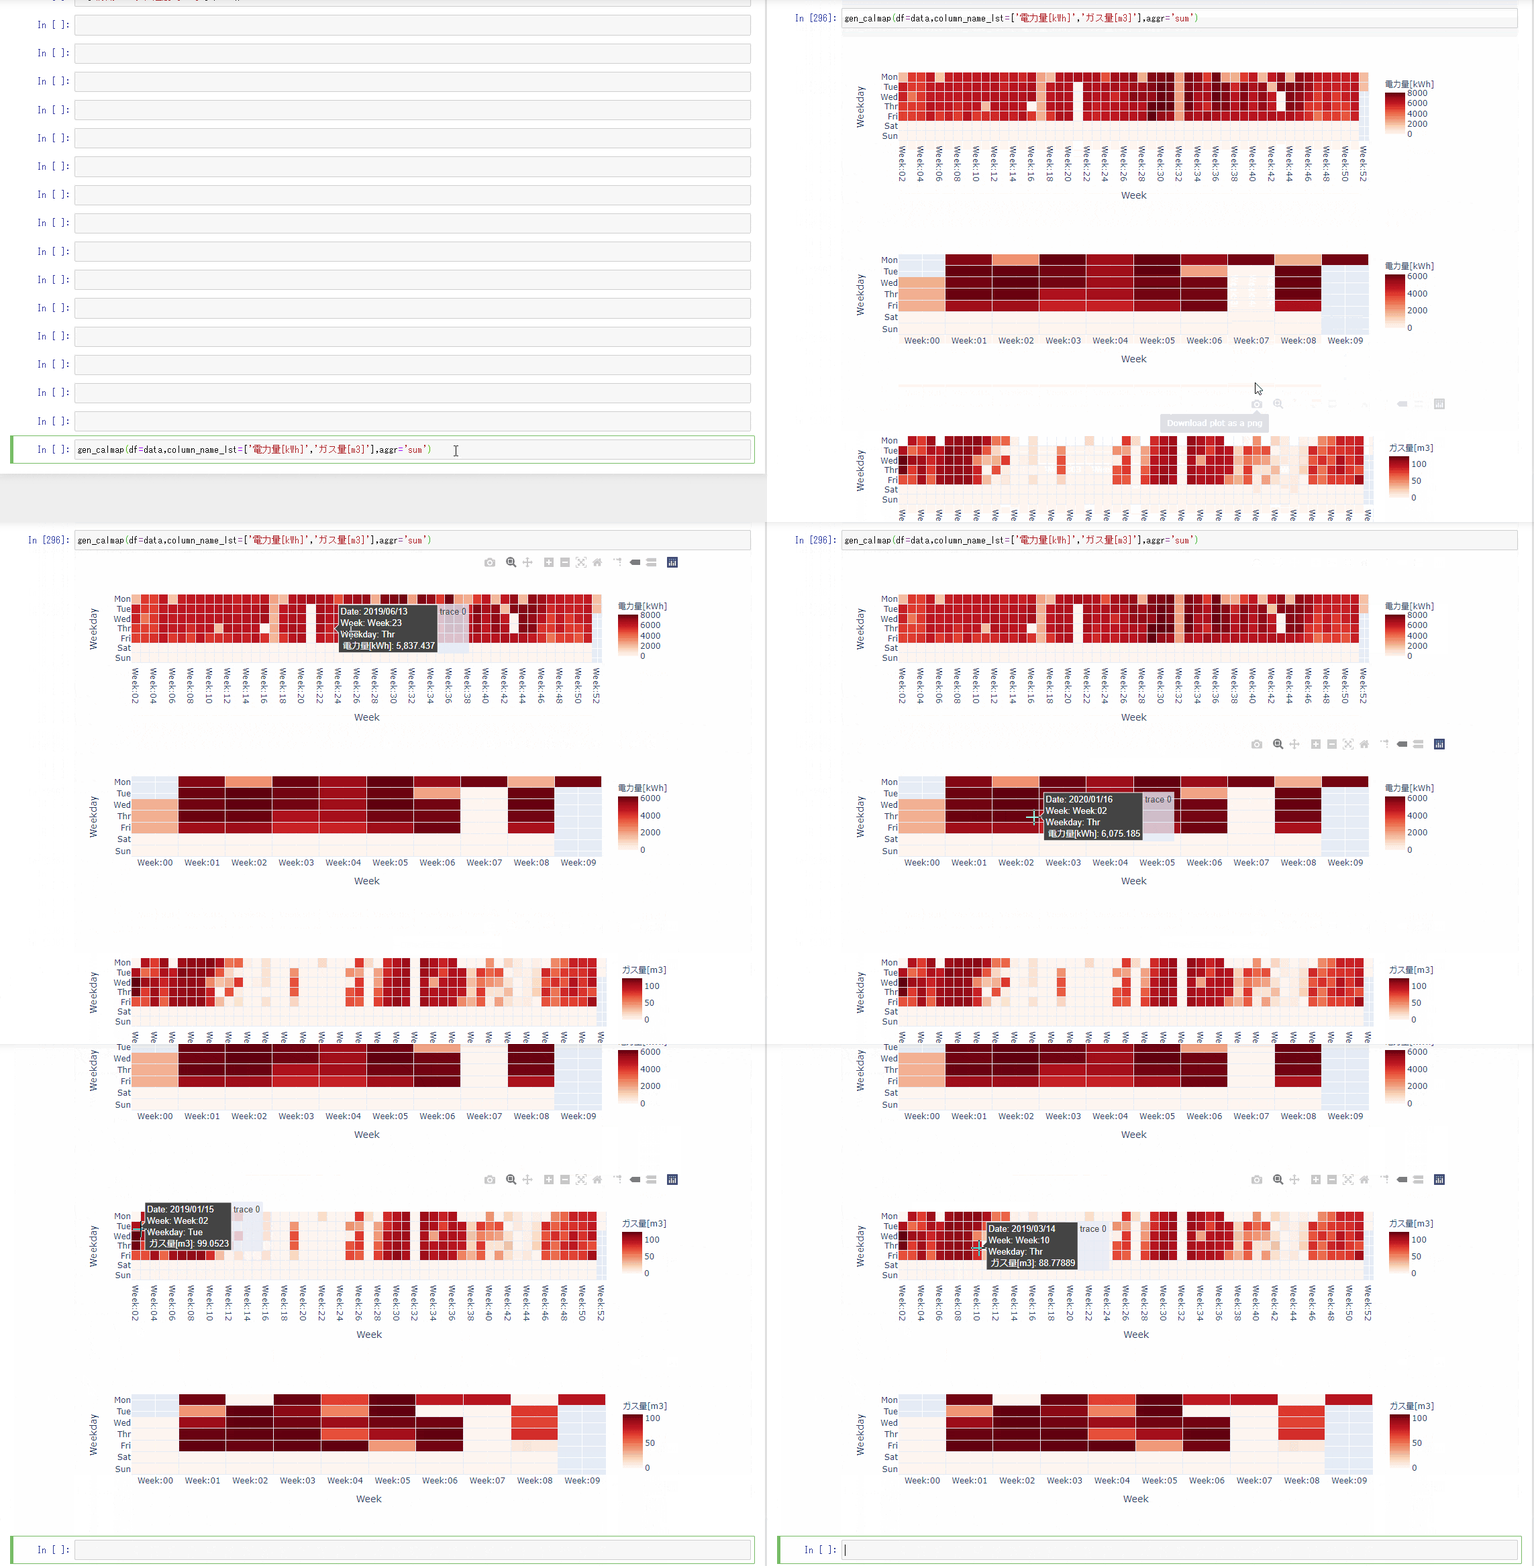
gen_calmap(df=data,column_name_lst=['電力量[kWh]','ガス量[m3]'],aggr='sum')
結果
- 割といい感じにできた。
まとめ
- 特にエラーのことは考えていない。
- Githubっぽくできた。

