SankyDiagramとは
サンキー・ダイアグラム(英Sankey diagram)は工程間の流量を表現する図表である。
矢印の太さで流れの量を表している。特にエネルギーや物資、経費等の変位を表す為に使われる。
出典:Wikipedia
plotly(PlotlyExpress)で実装するメリット
- データフレームを読み込める。
- コードが簡単に書ける。
- インタラクティブなグラフなので、ユーザーが動かすことができる
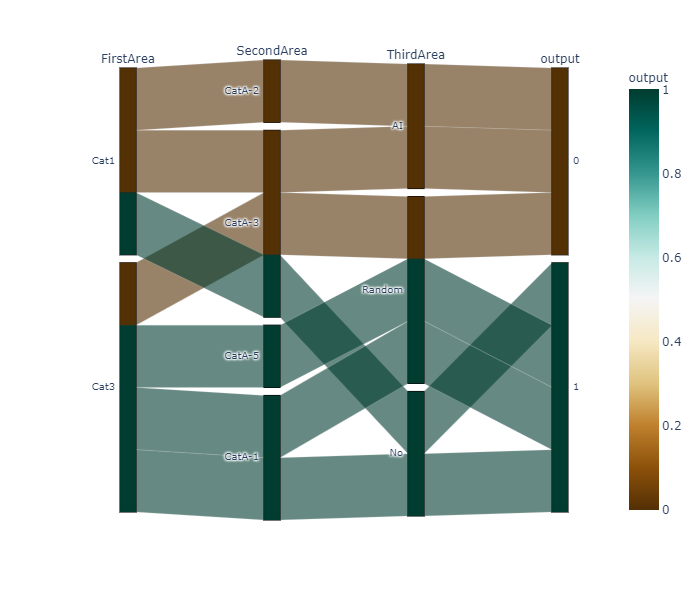
PlotlyでのSankeyDiagramの実装
import pandas as pd
import plotly.express as px

# DF生成
# 1行のデータが推移を表すようにデータフレームを作成する
df =pd.DataFrame([['Cat1', 'CatA-2', 'AI', 'Normal'],
                  ['Cat1', 'CatA-3', 'AI', 'Normal'],
                  ['Cat1', 'CatA-3', 'No', 'NG'],
                  ['Cat3', 'CatA-3', 'Random', 'Normal'],
                  ['Cat3', 'CatA-5', 'Random', 'NG'],
                  ['Cat3', 'CatA-1', 'Random', 'NG'],
                  ['Cat3', 'CatA-1', 'No', 'NG']],
                columns=['one','two','three',"output"])

# カテゴリー変数をダミー変数に
# データフレーム最終列が文字列だとエラー?
df["output"] = pd.get_dummies(df["output"])

fig = px.parallel_categories(df,
                             dimensions=['one','two','three','output'],
                             color="output",
                             color_continuous_scale=px.colors.diverging.BrBG,
                             labels={'one':'FirstArea', 'two':'SecondArea', 'three':'ThirdArea','output':'output'}
                            )
fig.show()
