数値解析や観測によって得られた風データをmatplotlibで表示する時のメモです.
矢羽根表示
plt.barbs(X, Y, U, V)を使う.
X:矢羽根を表示するx座標
Y:矢羽根を表示するy座標
U:東西風速
V:南北風速
その他の引数,
-
barb_increments=dict(half=1, full=5, flag=10)
短い矢羽根,長い矢羽根,旗を描くのに用いる値を設定できる(デフォルトは5,10,50). -
sizes=dict(emptybarb=0)
矢羽根同士の間隔(spaceing),矢羽根の根元から先端までの高さ(height),旗の幅(width),一番短い矢羽根よりも小さい値の表示に使われる円の半径(emtybarb)を設定できる.
emptybarb=0で風速が小さいものは表示させないようにできる.
import matplotlib.pyplot as plt
import numpy as np

U = np.array([0, -3, -5, 13])
V = np.array([0, -3, 5, 13])

plt.barbs(np.arange(4), np.arange(4),
          U, V,
          barb_increments=dict(half=1, full=5, flag=10)
         )

plt.grid()
plt.ylim(-1,4)
plt.show()
結果

【参考】
matplotlib Reference (matplotlib.pyplot.barbs)
風配図
windrose.WindroseAxes.bar(wind_d, wind_v)を使う.
wind_d:風速
wind_v:風向(degree)
その他の引数
-
normed=
Trueとすれば,NaNを除く全データに占める割合が半径r軸になる.
Falseではデータ数が半径r軸となる. -
nsector=
セクターの数を設定できる.デフォルトは16で,360/16=22.5°毎にセクターが描かれる. -
bins=
配列を入れることで,barを塗りつぶす色の閾値を設定できる(デフォルトでは風速の最小値から最大値を6分割する). -
cmap=
barを塗りつぶす色のカラーマップを指定できる. -
opening=
0.0 から 1.0 の間で,セクタ間のスペースを設定できる(1.0はスペースなし).
また,WindroseAxesのメソッドとして
-
windrose.WindroseAxes.set_rgrids(array, labels=[], fontsize=10)
r軸の設定ができる. -
windrose.WindroseAxes.set_legend(bbox_to_anchor=(x, y), fontsize=15)
風速による色塗りの凡例が設定できる.
import numpy as np
import matplotlib.pyplot as plt
from windrose import WindroseAxes

# make figure
fig = plt.figure(figsize=(10,10))

ax = WindroseAxes.from_ax(fig=fig)
ax.bar(wind_d, wind_v, normed=True, opening=0.8)

ax.set_rgrids(np.arange(0, 90, 10),labels=list(np.arange(0, 90, 10)),fontsize=15)
ax.set_legend()

plt.show()
複数のデータを描画する場合はこんな感じ.
ラベルや凡例の設定もしてみた.
import numpy as np
import matplotlib.pyplot as plt
from windrose import WindroseAxes


# make figure
fig = plt.figure()
ax1 = fig.add_subplot(1, 2, 1, axes_class=WindroseAxes)
ax2 = fig.add_subplot(1, 2, 2, axes_class=WindroseAxes)
fig.tight_layout(h_pad=2) # ax1 と ax2 の距離が近かったので設定

# rgrids params
r_ticks = np.arange(0,11, 1)
r_labels = np.arange(0, 11, 1).astype(str)
r_labels[-1] += ' %'
fontsize = 10
bins = np.arange(0, 361, 45)

# ax1
ax1.bar(np.arange(0, 360, 22.5), np.arange(0, 360, 22.5),
        normed=True,
        bins=bins
       )
ax1.set_rgrids(r_ticks, r_labels, fontsize=fontsize)
ax1.set_title('ax1')

# ax2
ax2.bar(np.arange(0, 360, 22.5), np.arange(0, 360, 22.5),
        normed=True,
        bins=bins
       )
ax2.set_rgrids(r_ticks, r_labels, fontsize=fontsize)
ax2.set_legend()
ax2.set_title('ax2')

# 2つのグラフの凡例は共通しているので1つだけ表示
ax2.set_legend(title='wind velocity (m/s)', loc="right", bbox_to_anchor=(1.7, 0.5))

plt.show()
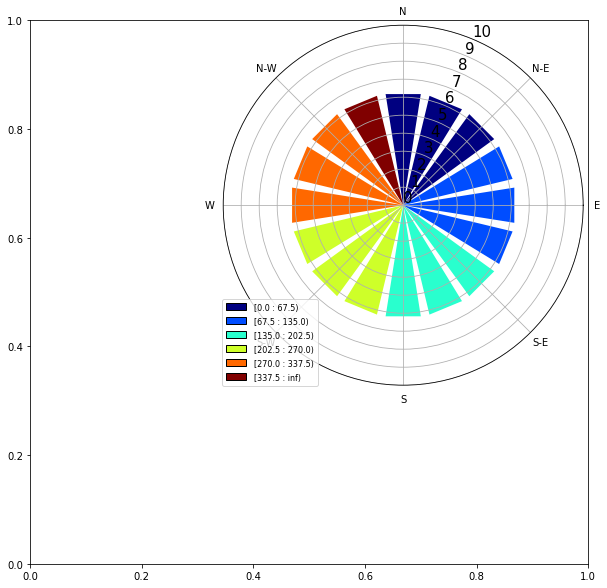
figureの中に風配図を入れることもできる.
import numpy as np
import matplotlib.pyplot as plt
from windrose import WindroseAxes
from mpl_toolkits.axes_grid1.inset_locator import inset_axes

# make figure
fig = plt.figure(figsize=(10,10))

ax = fig.add_subplot(1, 1, 1)

wind_ax_pos = (1,1)

wind_ax = inset_axes(ax,
                     width=5,
                     height=5,
                     bbox_to_anchor=wind_ax_pos,
                     axes_class=WindroseAxes,
                     bbox_transform=ax.transData)


wind_ax.bar(np.arange(0, 360, 22.5), np.arange(0, 360, 22.5), normed=True)
wind_ax.set_rgrids(np.arange(0, 11, 1), labels=list(np.arange(0, 11, 1)), fontsize=15)
wind_ax.set_legend()

plt.show()
結果

【参考】
windrose API
おまけ
ある地点の風を表す方法は,東西風Uと南北風V,もしくは風速wind_vと風向wind_dの2通りが主である.
風向は北を基準とすることに注意して,これらを相互に変換するサブ関数を作成した.
# wind_vとwind_dを,U,Vに変換する関数
def wd2UV(wind_v, wind_d):
    new_wd = np.deg2rad(-wind_d)-np.pi/2
    U = wind_v*np.cos(new_wd)
    V = wind_v*np.sin(new_wd)
    return U, V

# U,Vを,wind_vとwind_dに変換する関数
def UV2vd(U, V):
    wind_v = np.sqrt(U*U+V*V)
    wind_d = np.rad2deg(-np.arctan2(V, U)-np.pi/2)
    wind_d = np.where(abs(wind_d)<0.1, 0, wind_d)   # 1>>wind_dの時,wind_d=0とする
    wind_d = np.where(wind_d<0, wind_d+360, wind_d) # np.arctan2の戻り値は-piからpiのため補正
    return wind_v, wind_d

