はじめに
NetworkXとはPythonのグラフ描画パッケージです。
入力ファイル(辺と重み)が与えられたときの重み付きグラフを表示する方法をまとめておきます。
入力ファイル
辺(頂点1,頂点2), 重み
test.txt
1 2 5
1 3 8
2 4 3
3 5 5
4 5 10
グラフ作成
test.py
# パッケージのインポート
import matplotlib.pyplot as plt
import networkx as nx
# グラフの作成
G = nx.DiGraph()
# 重み付きのファイルの読み込み
G = nx.read_weighted_edgelist('test.txt', nodetype=int)
# レイアウトと頂点の色を適当に設定
pos = nx.spring_layout(G, k=0.7)
node_color = ['r' if i < 2 else 'b' for i in range(G.number_of_edges())]
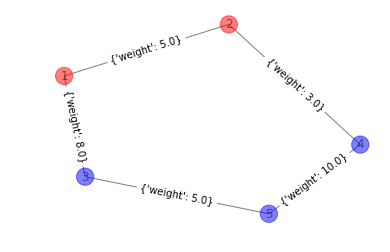
# グラフの描画
nx.draw_networkx_edge_labels(G,pos)
nx.draw_networkx(G, pos, with_labels=True, node_color=node_color, alpha=0.5)
# 表示
plt.axis("off")
plt.show()
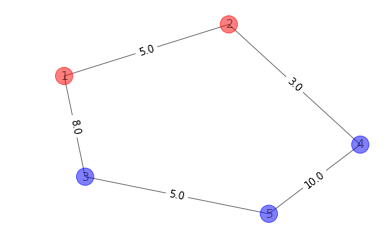
重みの数値だけを表示したいときは、edge_labelsを設定します。
# グラフの描画
edge_labels = {(i, j): w['weight'] for i, j, w in G.edges(data=True)}
nx.draw_networkx_edge_labels(G,pos, edge_labels=edge_labels)
nx.draw_networkx(G, pos, with_labels=True, node_color=node_color, alpha=0.5)