お題
前回、「Vegeta」を使ってGoogle App Engine + Cloud SQL を相手に負荷をかける準備をした。
今回は、実践編。
開発環境
# OS
$ cat /etc/os-release
NAME="Ubuntu"
VERSION="18.04.2 LTS (Bionic Beaver)"
# Cloud SDK
$ gcloud version
Google Cloud SDK 245.0.0
# Golang
$ go version
go version go1.11.4 linux/amd64
# Vegeta
$ vegeta -version
Version: cli/v12.2.0
Commit: 65db074680f5a0860d495e5fd037074296a4c425
Runtime: go1.11.4 linux/amd64
Date: 2019-01-20T15:07:37Z+0000
負荷のかけ先の情報
前回参照。
実践
事前準備・確認
Cloud SQL内のテーブルクリア
前回実施分のレコードが残っているのでクリア
MySQL [fs14db01]> select count(*) from user;
+----------+
| count(*) |
+----------+
|       10 |
+----------+
1 row in set (0.04 sec)

MySQL [fs14db01]> truncate table user;
Query OK, 0 rows affected (0.06 sec)

MySQL [fs14db01]>
MySQL [fs14db01]> select count(*) from user;
+----------+
| count(*) |
+----------+
|        0 |
+----------+
1 row in set (0.04 sec)
App Engineインスタンス数の確認
App Engineは負荷がかかると自動的にインスタンスを増やしてくれる。
今回は、ついでにそこも確認してみる。(そこまで負荷がかけられるかはわからないけど)
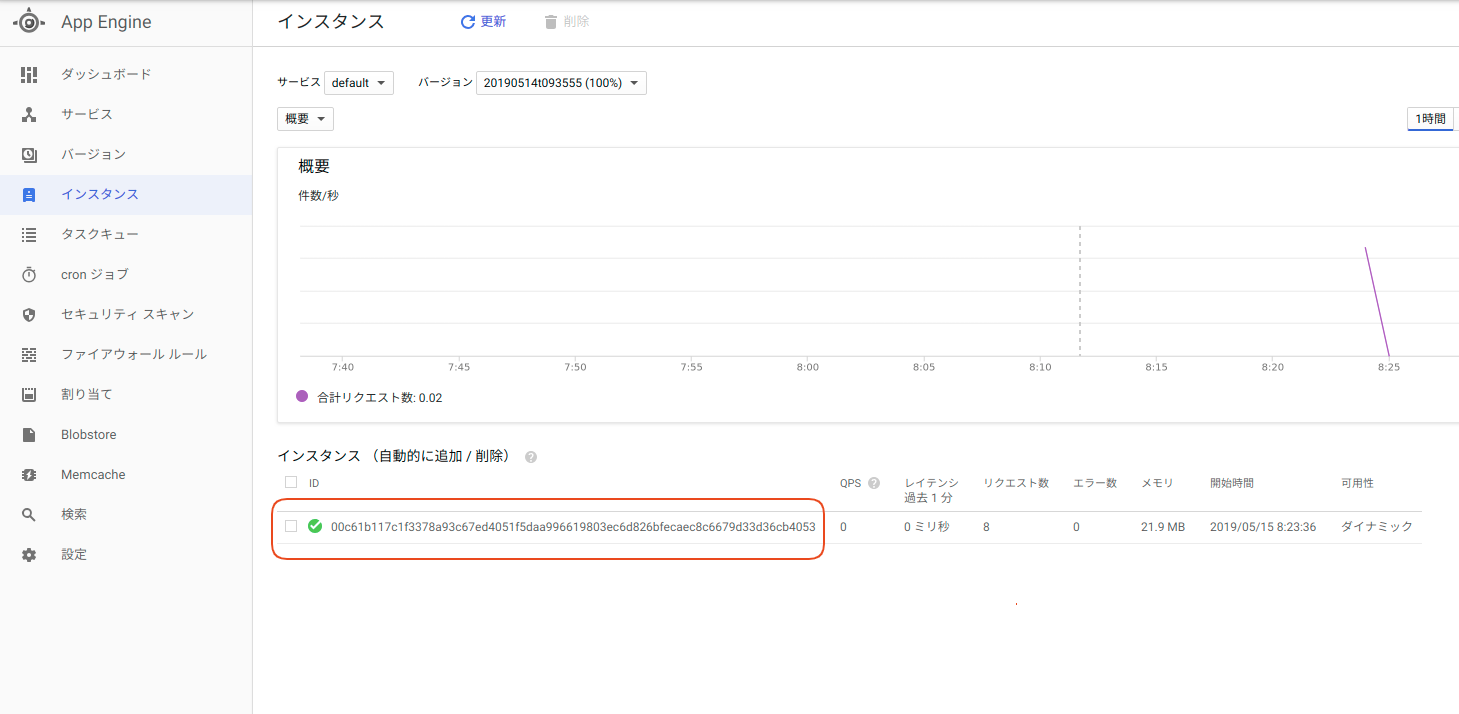
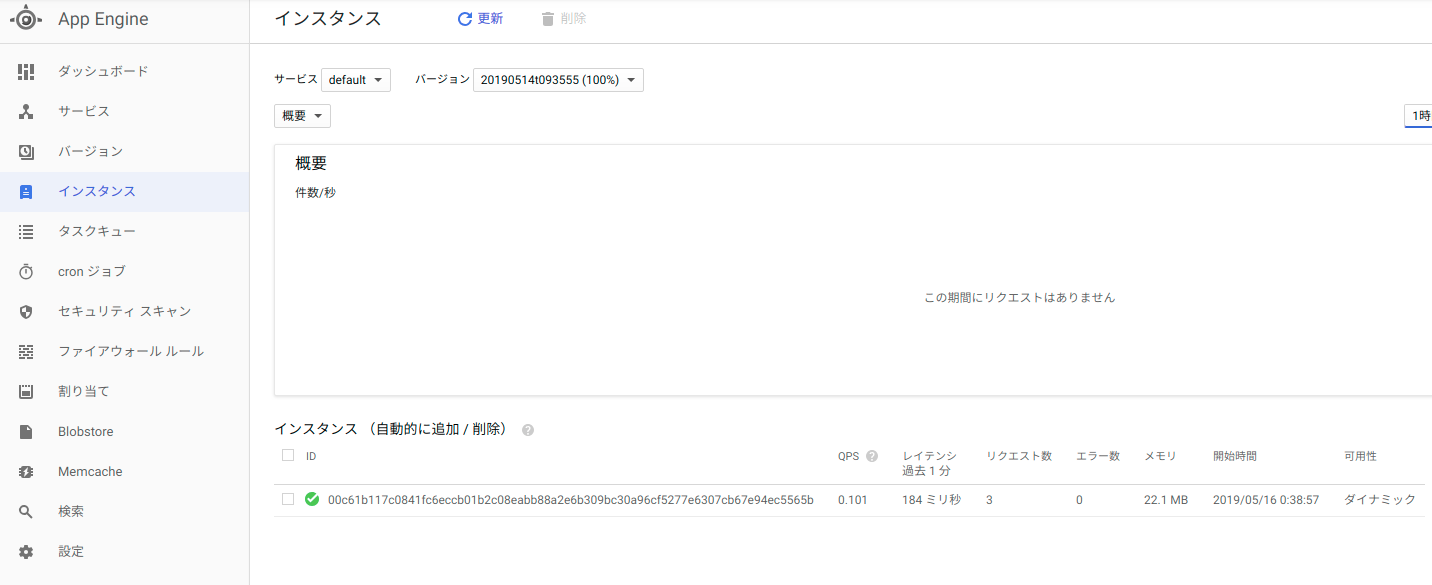
負荷かける前の状態では、インスタンス数「1」。
負荷テスト実施
毎秒10リクエストを10秒間
まずは様子見。
$ cat vegeta/gae_post_user.txt
POST https://【自分のGCPプロジェクトID】.appspot.com/users
$
$ vegeta attack -targets=vegeta/gae_post_user.txt -output=/tmp/vegeta_result.bin -rate=10 -duration=10s
結果。
$ vegeta report /tmp/vegeta_result.bin
Requests      [total, rate]            100, 10.10
Duration      [total, attack, wait]    9.926486768s, 9.900180231s, 26.306537ms
Latencies     [mean, 50, 95, 99, max]  33.160515ms, 27.191284ms, 45.601278ms, 224.497748ms, 317.825689ms
Bytes In      [total, mean]            500, 5.00
Bytes Out     [total, mean]            0, 0.00
Success       [ratio]                  100.00%
Status Codes  [code:count]             200:100
Error Set:
Cloud SQL内。
MySQL [fs14db01]> select count(*) from user;
+----------+
| count(*) |
+----------+
|      100 |
+----------+
1 row in set (0.04 sec)
App Engineインスタンス数。
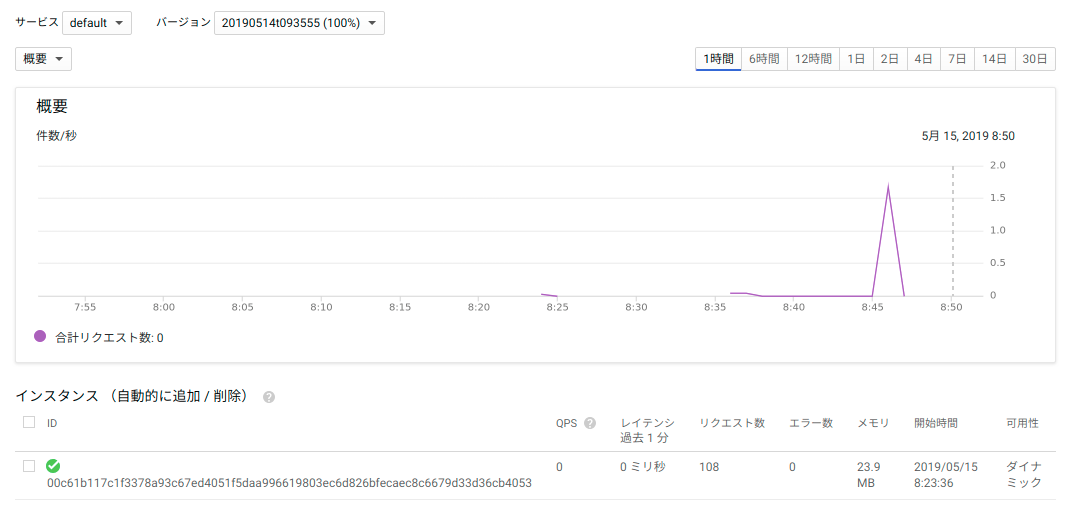
まあ、さすがにこの程度はなんてことないね。
コストチェック
試す前に、お金(※実際は「3万円の無料トライアル中」なので自分で出すお金は発生しないけど)がかかるのか、ちょっと確認。
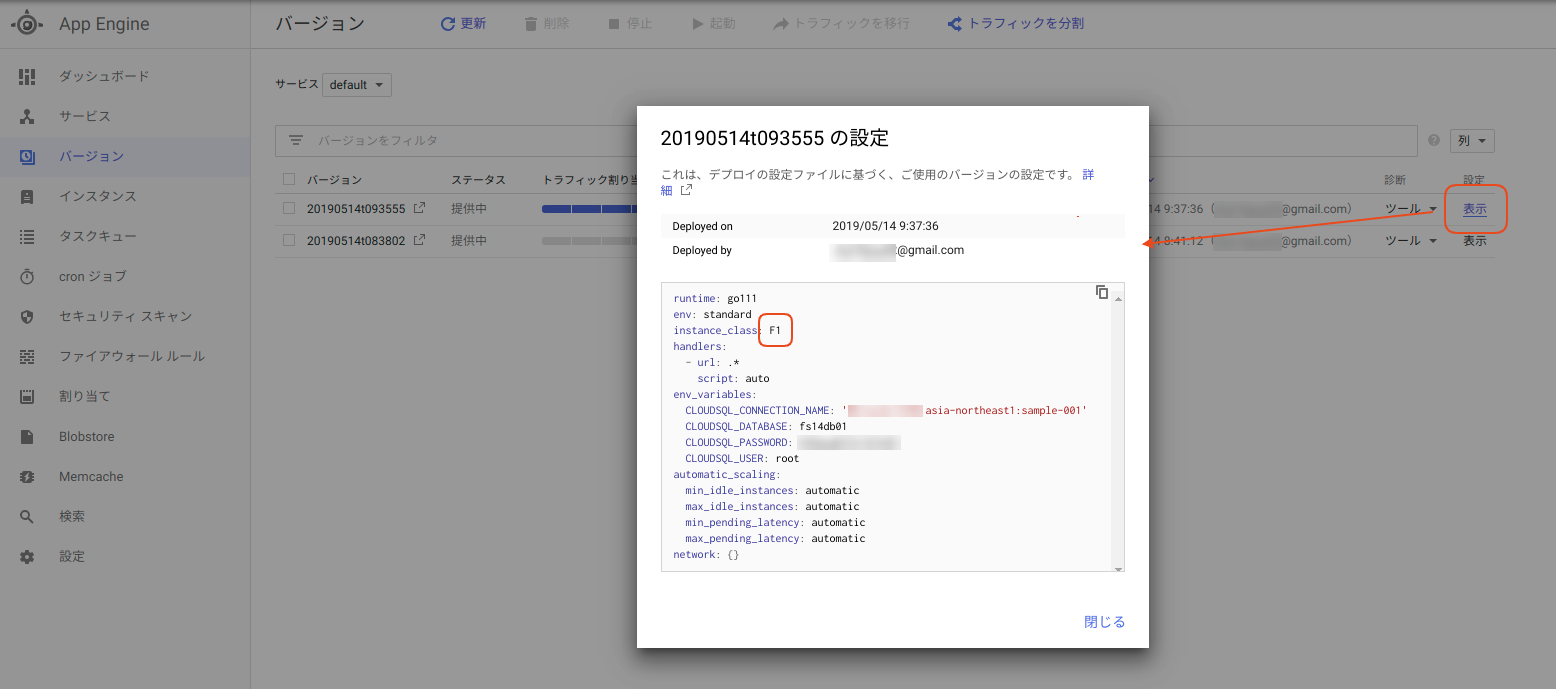
下記の通りApp Engineのインスタンスタイプは「F1」。
「F1」は稼働に1時間あたり「$0.07」かかるとのこと。
あとは、こういったことも課金対象。
https://cloud.google.com/appengine/pricing?hl=ja#header_1
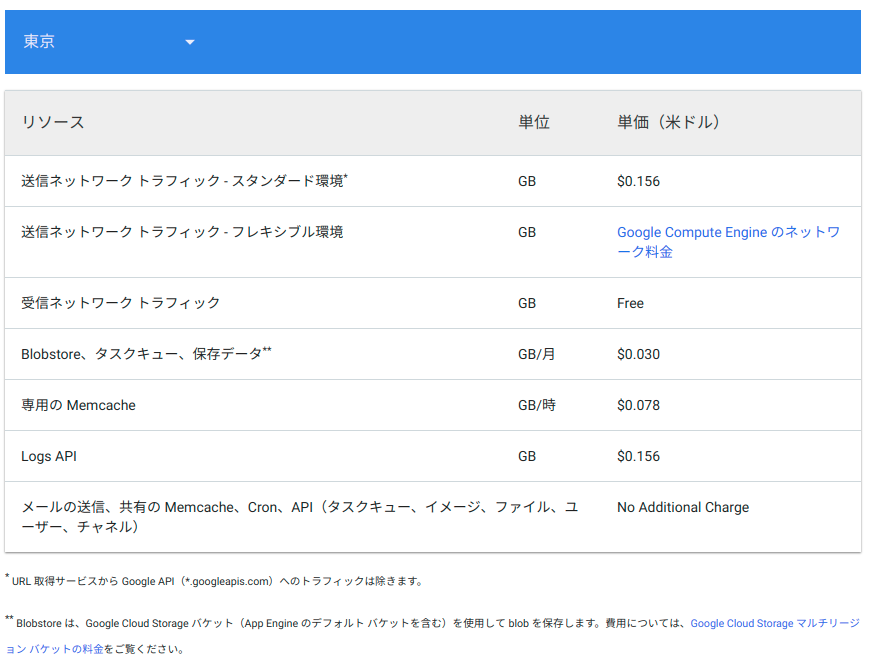
Always Freeな分は下記にまとまっている。
https://cloud.google.com/free/docs/always-free-usage-limits?hl=ja
Cloud SQLは?
上記以外の分は下記にある。
https://cloud.google.com/pricing/list?hl=ja
インスタンスが起動している時間の分だけかかる。
その中のCloud SQLの分は下記。
https://cloud.google.com/sql/pricing?hl=ja#2nd-gen-pricing
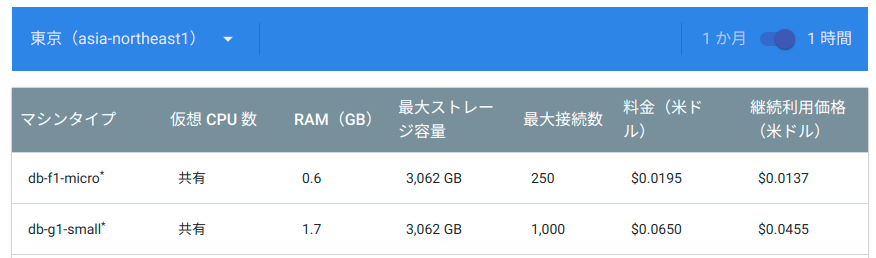
前回、「db-g1-small」にしたので、1時間あたり「$0.0650」。
基本的にはインスタンスを起動している時間に応じてコストがかかる様子。
これだけなら負荷をかけることは気にする必要ないように思うけど、負荷をかけると、App Engineインスタンスがオートスケールする可能性がある。
ここは注意して見ておく必要がありそう。
毎秒100リクエストを30秒間
$ vegeta attack -targets=vegeta/gae_post_user.txt -output=/tmp/vegeta_result.bin -rate=100 -duration=30s
結果。
$ vegeta report /tmp/vegeta_result.bin
Requests      [total, rate]            3000, 100.03
Duration      [total, attack, wait]    30.011642068s, 29.990171294s, 21.470774ms
Latencies     [mean, 50, 95, 99, max]  168.614471ms, 25.234807ms, 1.294188515s, 1.922027289s, 2.518173607s
Bytes In      [total, mean]            15000, 5.00
Bytes Out     [total, mean]            0, 0.00
Success       [ratio]                  100.00%
Status Codes  [code:count]             200:3000
Error Set:
Cloud SQL内。
MySQL [fs14db01]> select count(*) from user;
+----------+
| count(*) |
+----------+
|     3000 |
+----------+
1 row in set (0.04 sec)
さばききったけど、レイテンシーが。。。
とはいえ、前回の内容の通り、ローカルからのネットワークに大部分の時間がかかっているので、レイテンシーが大きいから単純に何が悪いと言えるわけではない。
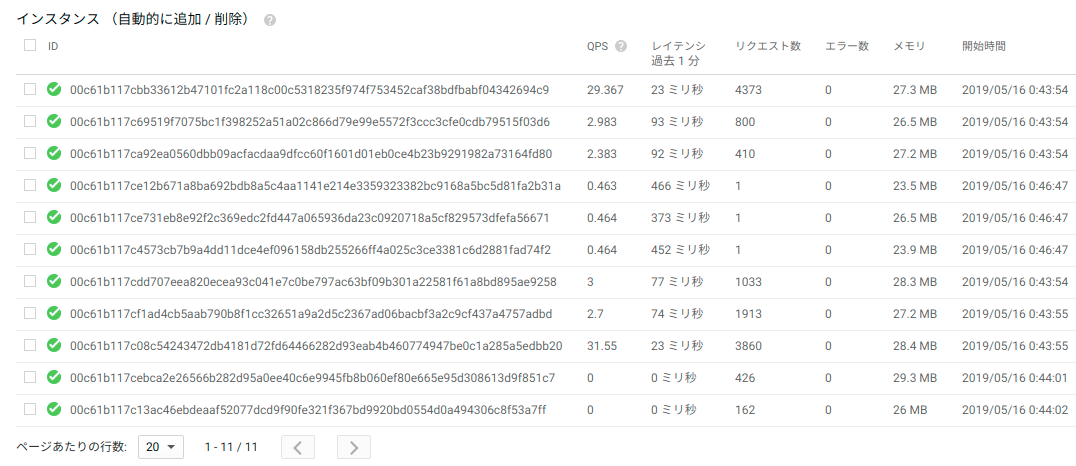
そうだ、App Engineのインスタンス数は。
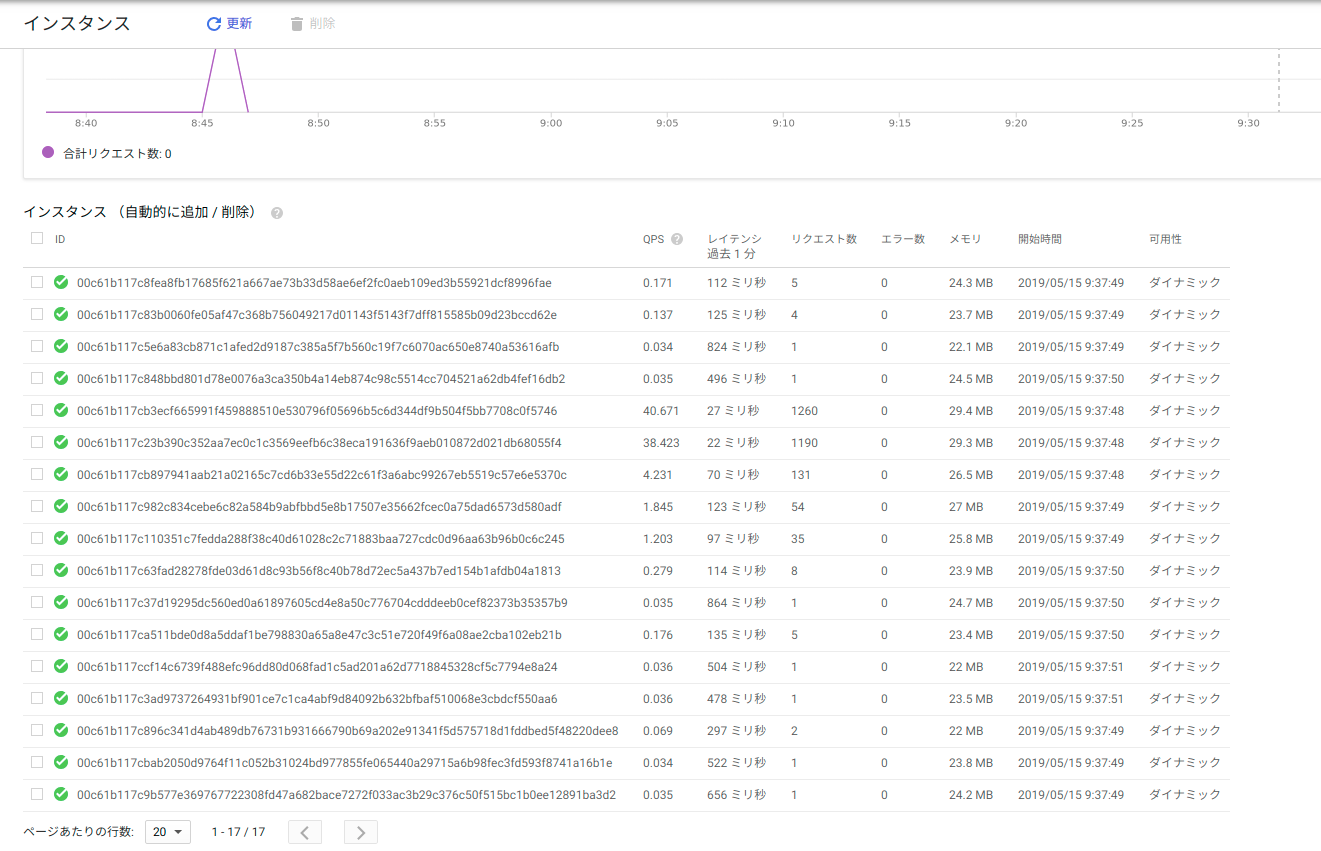
すごいことになってる。
レイテンシー大きくなった部分は、このインスタンス増加時の分かな。これだけスケールさせたのか・・・。
インスタンスのスペックが低いものを選んでいることもあるか。
ただ、しばらくすると、下記のようにインスタンス数、減った。
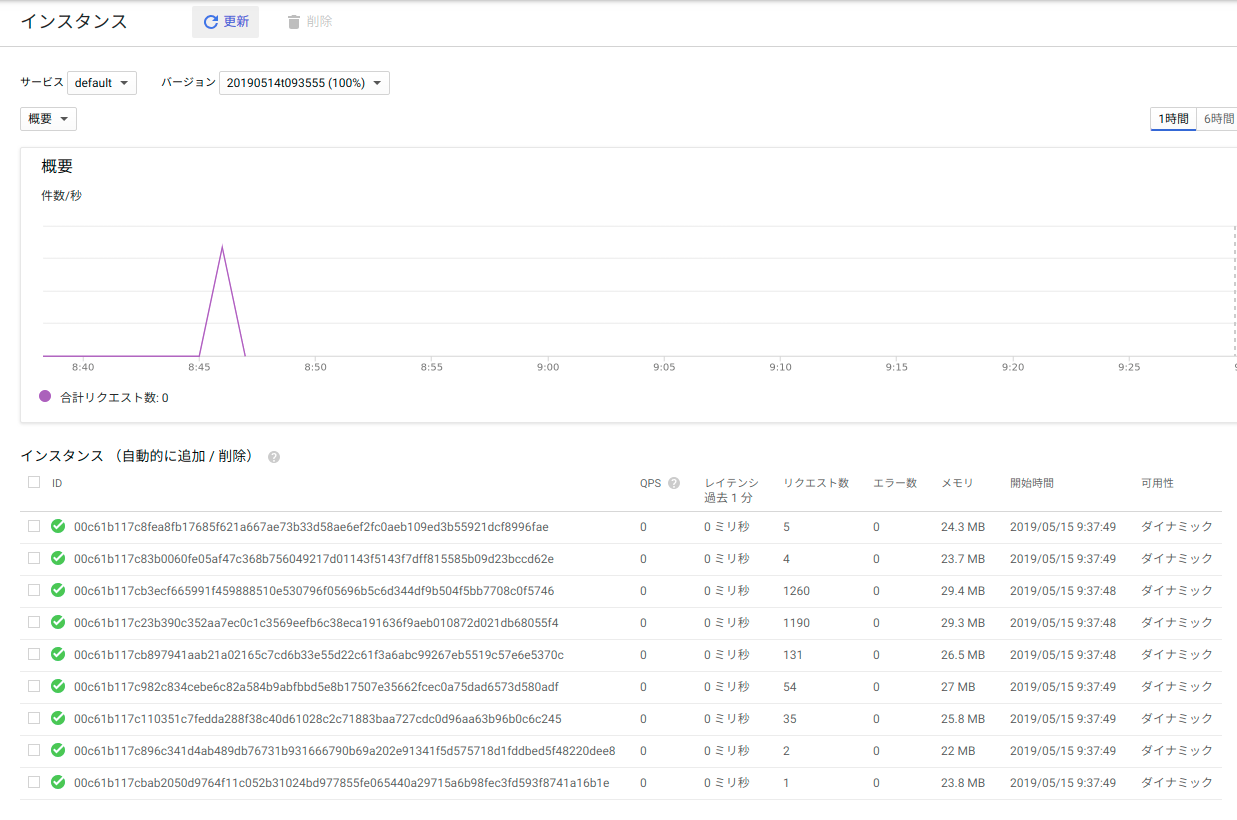
が、そこから数10分経過したけど、上の数からは減らない。 次回のスパイクに備えている?
毎秒1000リクエストを30秒間
Cloud SQLの最大同時接続数と同じ1000リクエストを毎秒、30秒間継続。
1リクエストの処理に1秒以上かかるようだと、さばけない分がどんどん溜まってくる想定。
事前状態
MySQL [fs14db01]> select count(*) from user;
+----------+
| count(*) |
+----------+
|        0 |
+----------+
1 row in set (0.04 sec)
負荷を与える
$ vegeta attack -targets=vegeta/gae_post_user.txt -output=/tmp/vegeta_result.bin -rate=1000 -duration=30s
途中状態。
MySQL [fs14db01]> select count(*) from user;
+----------+
| count(*) |
+----------+
|     9058 |
+----------+
1 row in set (0.03 sec)
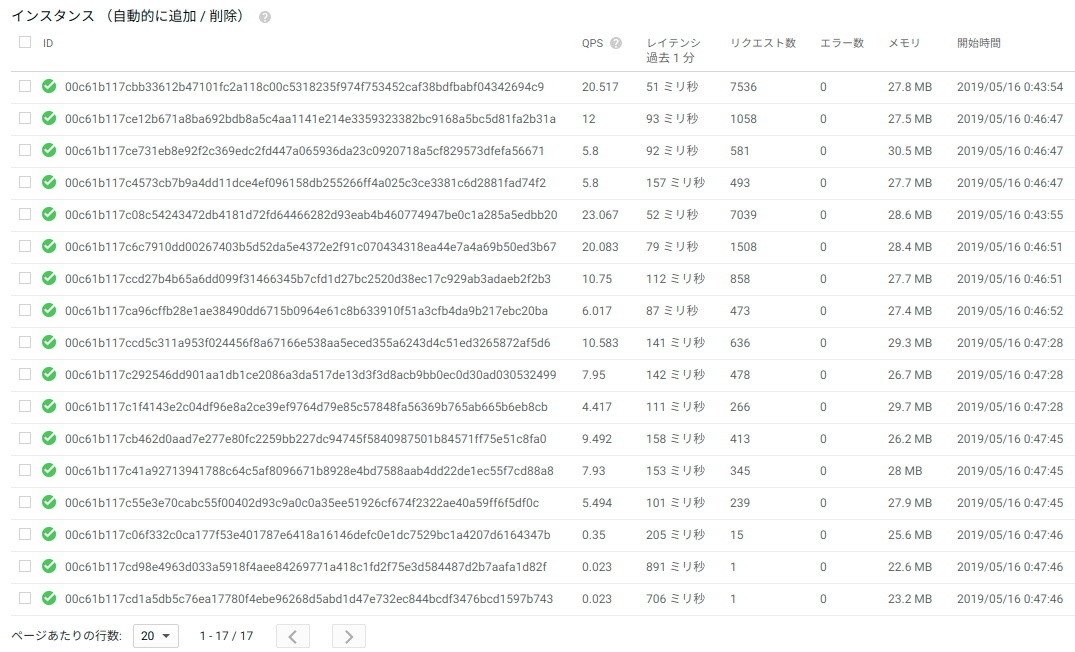
インスタンス大量増殖中。
結果
レイテンシーは凄いことになってるけど、秒間1000リクエストを30秒間、さばききった。
さすが、App Engine。
$ vegeta report /tmp/vegeta_result.bin
Requests      [total, rate]            30000, 999.93
Duration      [total, attack, wait]    4m1.300273398s, 30.002146891s, 3m31.298126507s
Latencies     [mean, 50, 95, 99, max]  2m7.601340499s, 2m33.860634611s, 3m44.787336406s, 3m52.926571102s, 4m1.152247619s
Bytes In      [total, mean]            150000, 5.00
Bytes Out     [total, mean]            0, 0.00
Success       [ratio]                  100.00%
Status Codes  [code:count]             200:30000
Error Set:
MySQL [fs14db01]> select count(*) from user;
+----------+
| count(*) |
+----------+
|    30000 |
+----------+
1 row in set (0.05 sec)
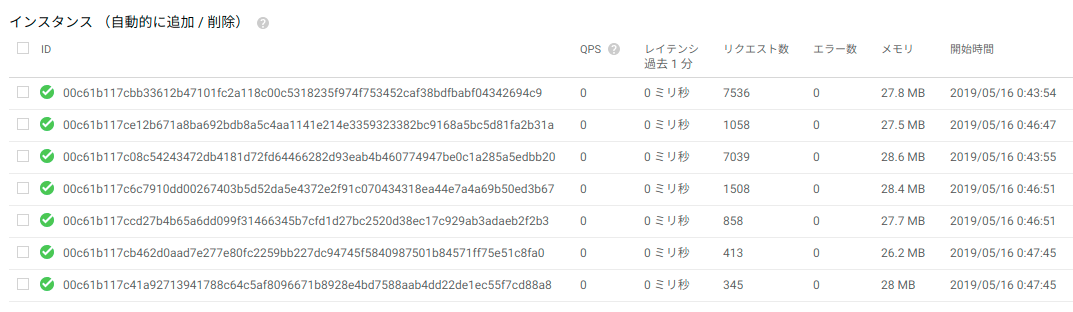
上記は、負荷ツール(Vegeta)による負荷実行終了直後。
そして、それから数分待つと、以下のインスタンス数まで自動で下がった。
まとめ
今回は、App Engine+Cloud SQL相手にローカルVegetaから負荷をかけてみる試み。
インスタンスの急増にビビったので、今日はここまで。