お題
たまたま、WebアクセスでレスポンスとしてもらうJSONのサイズとしては大きめと思われるものを解析する要件があったため、Goでよく使うJSONパースの仕方と、一度に大きなメモリを消費しないJSONパースの仕方とを比較してみた。
開発環境
# OS - Linux(Ubuntu)
$ cat /etc/os-release
NAME="Ubuntu"
VERSION="18.04.2 LTS (Bionic Beaver)"
# 言語 - Go
$ go version
go version go1.13.3 linux/amd64
# パッケージマネージャ - Go Modules
# IDE - Goland
GoLand 2019.2.5
Build #GO-192.7142.48, built on November 8, 2019
解析対象の大きめJSON
125MBのJSONを用意。
$ ll data.json
-rw-rw-r-- 1 sky0621 sky0621 125M Dec  7 11:33 data.json
$ less data.json

{
  "data": {
    "items": [
      {
        "id": "id-0",
        "name": "あいてむ0",
        "price": 0,
        "display": true
      },
      {
        "id": "id-1",
        "name": "あいてむ1",
        "price": 1,
        "display": true
      },
      {
        "id": "id-2",
        "name": "あいてむ2",
        "price": 2,
        "display": true
      },

      ・
      ・
      ・

    〜〜省略〜〜

      ・
      ・
      ・

      {
        "id": "id-999999",
        "name": "あいてむ999999",
        "price": 999999,
        "display": true
      }
    ]
  }
}
■大きめJSONを一息にオンメモリ
全量は下記。
https://github.com/sky0621/tips-go/tree/ca62a52dee0455a4c413db9a0001076f029b237d/try/bigjson
ソース
package main

import (
	"encoding/json"
	"fmt"
	"io/ioutil"
	"log"
	"time"

	"github.com/pkg/profile"
)

func main() {
	// 使用メモリチェック準備
	defer profile.Start(profile.MemProfile, profile.ProfilePath(".")).Stop()
	st := time.Now()

	// 125MBのファイルを読み込み
	ba, err := ioutil.ReadFile("./data.json")
	if err != nil {
		log.Fatal(err)
	}

	var bj *BigJSON
	// 125MBのデータをパース
	err = json.Unmarshal(ba, &bj)
	if err != nil {
		log.Fatal(err)
	}

	fmt.Printf("%f秒\n", time.Now().Sub(st).Seconds())
}

type BigJSON struct {
	Data *Data
}

type Data struct {
	Items []*Item
}

type Item struct {
	ID      string
	Name    string
	Price   int
	Display bool
}
実行結果
実行
$ pwd
/home/sky0621/work/src/go111/src/github.com/sky0621/tips-go/try/bigjson
$
$ go run main.go
2019/12/07 11:45:00 profile: memory profiling enabled (rate 4096), mem.pprof
2.838153秒
2019/12/07 11:45:03 profile: memory profiling disabled, mem.pprof
結果解析
$ ll mem.pprof
-rw-rw-r-- 1 sky0621 sky0621 1.7K Dec  7 11:45 mem.pprof
出力された mem.pprof を解析
$ go tool pprof memory mem.pprof
memory: open memory: no such file or directory
Fetched 1 source profiles out of 2
File: main
Type: inuse_space
Time: Dec 7, 2019 at 11:45am (JST)
Entering interactive mode (type "help" for commands, "o" for options)
(pprof)
解析結果を画像出力
(pprof) png
Generating report in profile001.png
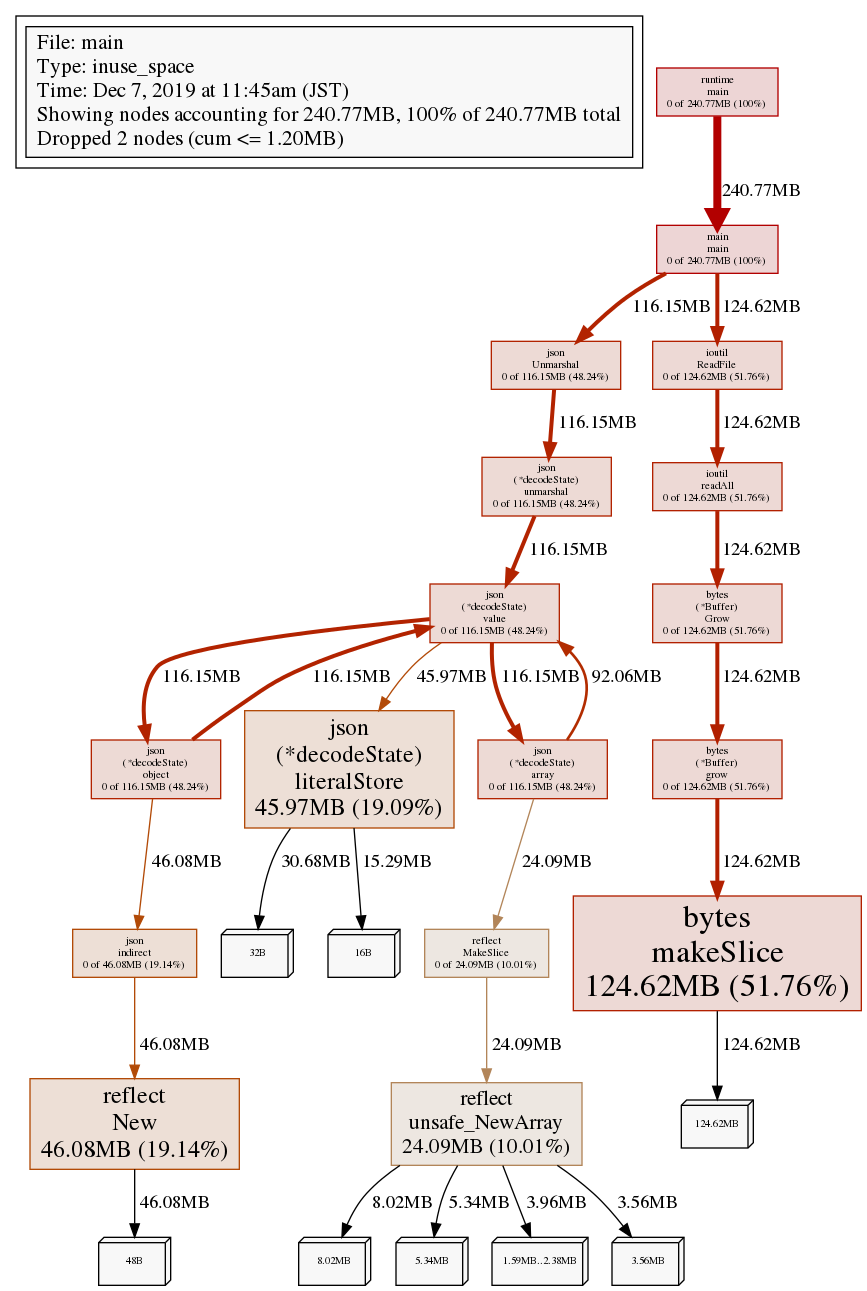
125MBのJSONファイルを一気に読み込んでいる ioutil.ReadFile() でファイルサイズと同等のメモリ使用。
そして、そのサイズ分のJSON構造を指定の構造に変換する json.Unmarshal() で、やはりファイルサイズと同等のメモリ使用。
結果、プログラム実行中、瞬間のメモリ消費量としては MAX125MB弱、プログラム実行全体では 240MB ほどメモリを消費したという結果。
解析結果のメモリ使用上位を標準出力
(pprof) top
Showing nodes accounting for 240.77MB, 100% of 240.77MB total
Dropped 2 nodes (cum <= 1.20MB)
Showing top 10 nodes out of 17
      flat  flat%   sum%        cum   cum%
  124.62MB 51.76% 51.76%   124.62MB 51.76%  bytes.makeSlice
   46.08MB 19.14% 70.90%    46.08MB 19.14%  reflect.New
   45.97MB 19.09% 89.99%    45.97MB 19.09%  encoding/json.(*decodeState).literalStore
   24.09MB 10.01%   100%    24.09MB 10.01%  reflect.unsafe_NewArray
         0     0%   100%   124.62MB 51.76%  bytes.(*Buffer).Grow
         0     0%   100%   124.62MB 51.76%  bytes.(*Buffer).grow
         0     0%   100%   116.15MB 48.24%  encoding/json.(*decodeState).array
         0     0%   100%   116.15MB 48.24%  encoding/json.(*decodeState).object
         0     0%   100%   116.15MB 48.24%  encoding/json.(*decodeState).unmarshal
         0     0%   100%   116.15MB 48.24%  encoding/json.(*decodeState).value
(pprof)
■大きめJSONを順繰りパース
ソース
全量は下記。
https://github.com/sky0621/tips-go/tree/ca62a52dee0455a4c413db9a0001076f029b237d/try/bigjson2
package main

import (
	"encoding/json"
	"fmt"
	"log"
	"os"
	"time"

	"github.com/pkg/profile"
)

func main() {
	// 使用メモリチェック準備
	defer profile.Start(profile.MemProfile, profile.ProfilePath(".")).Stop()
	st := time.Now()

	f, err := os.Open("./data.json")
	if err != nil {
		log.Fatal(err)
	}
	defer func() {
		if err := f.Close(); err != nil {
			log.Fatal(err)
		}
	}()

	dec := json.NewDecoder(f)

	bj := &BigJSON{}
	// 以下のJSON構造をトークン毎(「 { 」、「 "data" 」、「 { 」、「 "items" 」、「 [ 」、・・・)に辿る。
	// ★「 [ 」以降は Item 構造体にパースするObject構造が複数続くので、後続の dec.Decode() に任せる。
	// {
	//   "data": {
	//     "items": [
	//       {
	//        "id": "id-0",
	//        "name": "あいてむ0",
	//        "price": 0,
	//        "display": true
	//      },
	//        〜〜省略〜〜
	//      {
	//        "id": "id-999999",
	//        "name": "あいてむ999999",
	//        "price": 999999,
	//        "display": true
	//      }
	//    ]
	//  }
	//}
	for {
		t, err := dec.Token()
		if err != nil {
			log.Fatal(err)
		}

		if ele, ok := t.(string); ok {
			if ele == "data" {
				bj.Data = &Data{}
				continue
			}
			if ele == "items" {
				bj.Data.Items = []*Item{}
				continue
			}
		}
		if de, ok := t.(json.Delim); ok {
			if de.String() == "[" {
				// ここまで辿れば、後は後続の dec.Decode() に任せるため break
				break
			}
		}
	}

	// ここに来た時点で、Item 構造体にパース可能なObject構造が複数続くので、ある分だけひたすらパース
	for dec.More() {
		var item *Item
		err := dec.Decode(&item)
		if err != nil {
			log.Fatal(err)
		}
		bj.Data.Items = append(bj.Data.Items, item)
	}

	fmt.Printf("%f秒\n", time.Now().Sub(st).Seconds())
}

type BigJSON struct {
	Data *Data
}

type Data struct {
	Items []*Item
}

type Item struct {
	ID      string
	Name    string
	Price   int
	Display bool
}
実行結果
実行
$ pwd
/home/sky0621/work/src/go111/src/github.com/sky0621/tips-go/try/bigjson2
$
$ go run main.go
2019/12/07 21:01:37 profile: memory profiling enabled (rate 4096), mem.pprof
3.356228秒
2019/12/07 21:01:40 profile: memory profiling disabled, mem.pprof
結果解析
$ ll mem.pprof
-rw-rw-r-- 1 sky0621 sky0621 1.2K Dec  7 21:01 mem.pprof
出力された mem.pprof を解析
$ go tool pprof memory mem.pprof
memory: open memory: no such file or directory
Fetched 1 source profiles out of 2
File: main
Type: inuse_space
Time: Dec 7, 2019 at 9:01pm (JST)
Entering interactive mode (type "help" for commands, "o" for options)
(pprof)
解析結果を画像出力
(pprof) png
Generating report in profile001.png
(pprof)

125MBのJSONファイルを一気に読み込むのではなく、同一構造体の繰り返しである Item でパースされる構造の単位でループ処理。
それにより1ループ中で 28MB ほどのメモリ使用。
プログラム実行中、瞬間のメモリ消費量としては MAX28MBほどとなり、一気に読み込む実装と比べると格段の差が出る。
解析結果のメモリ使用上位を標準出力
(pprof) top
Showing nodes accounting for 35.07MB, 100% of 35.07MB total
      flat  flat%   sum%        cum   cum%
   14.38MB 41.02% 41.02%    14.38MB 41.02%  reflect.New
   14.27MB 40.68% 81.70%    14.27MB 40.68%  encoding/json.(*decodeState).literalStore
    6.42MB 18.30%   100%    35.07MB   100%  main.main
         0     0%   100%    28.65MB 81.70%  encoding/json.(*Decoder).Decode
         0     0%   100%    28.65MB 81.70%  encoding/json.(*decodeState).object
         0     0%   100%    28.65MB 81.70%  encoding/json.(*decodeState).unmarshal
         0     0%   100%    28.65MB 81.70%  encoding/json.(*decodeState).value
         0     0%   100%    14.38MB 41.02%  encoding/json.indirect
         0     0%   100%    35.07MB   100%  runtime.main
まとめ
大きめなJSONファイルを一気にオンメモリにすると当然ながら、そのサイズ分だけの負荷がかかる。
JSON構造に依存するものの繰り返し部分をループで順繰り処理する形に変えることでプログラム実行中の最大メモリ消費量は抑えられる。
ちなみに、pprof のヘルプを表示するといろんなコマンドがあるのがわかる。
(pprof) help
  Commands:
    callgrind        Outputs a graph in callgrind format
    comments         Output all profile comments
    disasm           Output assembly listings annotated with samples
    dot              Outputs a graph in DOT format
    eog              Visualize graph through eog
    evince           Visualize graph through evince
    gif              Outputs a graph image in GIF format
    gv               Visualize graph through gv
    kcachegrind      Visualize report in KCachegrind
    list             Output annotated source for functions matching regexp
    pdf              Outputs a graph in PDF format
    peek             Output callers/callees of functions matching regexp
    png              Outputs a graph image in PNG format
    proto            Outputs the profile in compressed protobuf format
    ps               Outputs a graph in PS format
    raw              Outputs a text representation of the raw profile
    svg              Outputs a graph in SVG format
    tags             Outputs all tags in the profile
    text             Outputs top entries in text form
    top              Outputs top entries in text form
    topproto         Outputs top entries in compressed protobuf format
    traces           Outputs all profile samples in text form
    tree             Outputs a text rendering of call graph
    web              Visualize graph through web browser
    weblist          Display annotated source in a web browser
    o/options        List options and their current values
    quit/exit/^D     Exit pprof

  Options:
    call_tree        Create a context-sensitive call tree
    compact_labels   Show minimal headers
    divide_by        Ratio to divide all samples before visualization
    drop_negative    Ignore negative differences
    edgefraction     Hide edges below <f>*total
    focus            Restricts to samples going through a node matching regexp
    hide             Skips nodes matching regexp
    ignore           Skips paths going through any nodes matching regexp
    mean             Average sample value over first value (count)
    nodecount        Max number of nodes to show
    nodefraction     Hide nodes below <f>*total
    noinlines        Ignore inlines.
    normalize        Scales profile based on the base profile.
    output           Output filename for file-based outputs
    prune_from       Drops any functions below the matched frame.
    relative_percentages Show percentages relative to focused subgraph
    sample_index     Sample value to report (0-based index or name)
    show             Only show nodes matching regexp
    show_from        Drops functions above the highest matched frame.
    source_path      Search path for source files
    tagfocus         Restricts to samples with tags in range or matched by regexp
    taghide          Skip tags matching this regexp
    tagignore        Discard samples with tags in range or matched by regexp
    tagshow          Only consider tags matching this regexp
    trim             Honor nodefraction/edgefraction/nodecount defaults
    trim_path        Path to trim from source paths before search
    unit             Measurement units to display

  Option groups (only set one per group):
    cumulative
      cum              Sort entries based on cumulative weight
      flat             Sort entries based on own weight
    granularity
      addresses        Aggregate at the address level.
      filefunctions    Aggregate at the function level.
      files            Aggregate at the file level.
      functions        Aggregate at the function level.
      lines            Aggregate at the source code line level.
  :   Clear focus/ignore/hide/tagfocus/tagignore

  type "help <cmd|option>" for more information
(pprof)