お題
なかなかなネーミングのGolang製の負荷テストツール「Vegeta」の使用記録。
上記にインストール方法やオプションなど詳しく書いているけど、日本語だと↓がわかりやすかった。(Google App Engine相手に負荷をかけた事例なども載ってる。)
ちょっと良さげな負荷ツール vegeta をつかって分散負荷試験を実現してみる
当記事では、正確に負荷を測定するのではなく、ローカル環境(Ubuntu)を相手に負荷ツールのコマンドオプションのうち手軽に試せるものだけ試してみる。
開発環境
# OS
$ cat /etc/os-release
NAME="Ubuntu"
VERSION="18.04.2 LTS (Bionic Beaver)"
# Cloud SDK
$ gcloud version
Google Cloud SDK 241.0.0
# Golang
$ go version
go version go1.11.4 linux/amd64
# Vegeta
$ vegeta -version
Version: cli/v12.2.0
Commit: 65db074680f5a0860d495e5fd037074296a4c425
Runtime: go1.11.4 linux/amd64
Date: 2019-01-20T15:07:37Z+0000
実践
アプリソース
GETリクエストを受けたら"OK"と返すだけ。
package main

import (
	"fmt"
	"net/http"
	"os"

	"github.com/labstack/echo"
)

func main() {
	e := echo.New()

	e.GET("/", func(c echo.Context) error {
		return c.JSON(http.StatusOK, "OK")
	})

	e.Logger.Fatal(e.Start(":8080"))
}
アプリ起動
$ go run main.go

   ____    __
  / __/___/ /  ___
 / _// __/ _ \/ _ \
/___/\__/_//_/\___/ v3.3.10-dev
High performance, minimalist Go web framework
https://echo.labstack.com
____________________________________O/_______
                                    O\
⇨ http server started on [::]:8080
ローカル環境
まずは手軽に。手元のローカルLinux(Ubuntu)マシン上で試してみる。
他のソフトも動いている状況なので、厳密な負荷の計測はできない。
Spec
CPUはコア4つ。メモリは16GB。(半分くらい他のソフト関連で使用済みだけど。)
CPU
$ cat /proc/cpuinfo
processor	: 0
 〜〜 省略 〜〜
model name	: Intel(R) Core(TM) i5-6200U CPU @ 2.30GHz
 〜〜 省略 〜〜
cpu MHz		: 600.006
cache size	: 3072 KB
 〜〜 省略 〜〜

processor	: 1
 〜〜 省略 〜〜
model name	: Intel(R) Core(TM) i5-6200U CPU @ 2.30GHz
 〜〜 省略 〜〜
cpu MHz		: 600.008
cache size	: 3072 KB
 〜〜 省略 〜〜

processor	: 2
 〜〜 省略 〜〜
model name	: Intel(R) Core(TM) i5-6200U CPU @ 2.30GHz
 〜〜 省略 〜〜
cpu MHz		: 600.008
cache size	: 3072 KB
 〜〜 省略 〜〜

processor	: 3
 〜〜 省略 〜〜
model name	: Intel(R) Core(TM) i5-6200U CPU @ 2.30GHz
 〜〜 省略 〜〜
cpu MHz		: 600.016
cache size	: 3072 KB
 〜〜 省略 〜〜
Memory
$ cat /proc/meminfo
MemTotal:       16341516 kB
MemFree:          565220 kB
MemAvailable:    7626996 kB
Buffers:          852652 kB
Cached:          6772228 kB
SwapCached:            0 kB
 〜〜 省略 〜〜
$ free -h
              total        used        free      shared  buff/cache   available
Mem:            15G        7.1G        604M        794M        7.8G        7.3G
Swap:          975M          0B        975M
コマンドオプション
■様子見で負荷をかける
秒間100リクエスト程度(-rate=100)を10秒間(-duration=10s)実行
$ echo "GET http://localhost:8080/" | vegeta attack -rate=100 -duration=10s | tee /tmp/vegeta_result.bin
【結果】
トータル1000リクエストのすべてが 200 OK ステータスをリターン。
最大でも5.7ミリ秒のレイテンシー。
$ vegeta report /tmp/vegeta_result.bin
Requests      [total, rate]            1000, 100.10
Duration      [total, attack, wait]    9.990260667s, 9.990017961s, 242.706µs
Latencies     [mean, 50, 95, 99, max]  454.834µs, 388.011µs, 838.325µs, 1.133989ms, 5.726576ms
Bytes In      [total, mean]            5000, 5.00
Bytes Out     [total, mean]            0, 0.00
Success       [ratio]                  100.00%
Status Codes  [code:count]             200:1000
Error Set:
秒間1000リクエスト程度(-rate=1000)を5秒間(-duration=5s)実行
$ echo "GET http://localhost:8080/" | vegeta attack -rate=1000 -duration=5s | tee /tmp/vegeta_result.bin
結果。
まだ余裕がある。
$ vegeta report /tmp/vegeta_result.bin
Requests      [total, rate]            5000, 1000.19
Duration      [total, attack, wait]    4.999351596s, 4.999039751s, 311.845µs
Latencies     [mean, 50, 95, 99, max]  348.195µs, 290.745µs, 731.884µs, 1.273013ms, 5.416903ms
Bytes In      [total, mean]            25000, 5.00
Bytes Out     [total, mean]            0, 0.00
Success       [ratio]                  100.00%
Status Codes  [code:count]             200:5000
Error Set:
秒間1000リクエスト程度(-rate=1000)を5秒間(-duration=5s)実行
$ echo "GET http://localhost:8080/" | vegeta attack -rate=10000 -duration=5s | tee /tmp/vegeta_result.bin
結果。
秒間1万リクエスト。ようやく 200 OK ステータスにならないものが出てきた。
$ vegeta report /tmp/vegeta_result.bin
Requests      [total, rate]            50000, 10000.08
Duration      [total, attack, wait]    5.000081913s, 4.999958231s, 123.682µs
Latencies     [mean, 50, 95, 99, max]  6.30789ms, 244.893µs, 35.773316ms, 129.544926ms, 308.935974ms
Bytes In      [total, mean]            247035, 4.94
Bytes Out     [total, mean]            0, 0.00
Success       [ratio]                  98.81%
Status Codes  [code:count]             0:593  200:49407
Error Set:
Get http://localhost:8080/: dial tcp 0.0.0.0:0->127.0.0.1:8080: socket: too many open files
Get http://localhost:8080/: net/http: timeout awaiting response headers
■負荷ツールが使うCPU数の制御
ローカル端末のCPUコア数は「4」
使用CPU数4で秒間5000リクエストを10秒
$ echo "GET http://localhost:8080/" | vegeta -cpus 4 attack -rate=5000 -duration=10s | tee /tmp/vegeta_result.bin
$ vegeta report /tmp/vegeta_result.bin
Requests      [total, rate]            50000, 5000.09
Duration      [total, attack, wait]    10.000023701s, 9.999829949s, 193.752µs
Latencies     [mean, 50, 95, 99, max]  297.119µs, 152.028µs, 935.019µs, 2.94928ms, 9.298685ms
Bytes In      [total, mean]            250000, 5.00
Bytes Out     [total, mean]            0, 0.00
Success       [ratio]                  100.00%
Status Codes  [code:count]             200:50000
Error Set:
使用CPU数2で秒間5000リクエストを10秒
$ echo "GET http://localhost:8080/" | vegeta -cpus 2 attack -rate=5000 -duration=10s | tee /tmp/vegeta_result.bin
$ vegeta report /tmp/vegeta_result.bin
Requests      [total, rate]            50000, 5000.01
Duration      [total, attack, wait]    10.000711198s, 9.999970837s, 740.361µs
Latencies     [mean, 50, 95, 99, max]  465.954µs, 158.743µs, 1.5962ms, 5.100328ms, 34.235606ms
Bytes In      [total, mean]            250000, 5.00
Bytes Out     [total, mean]            0, 0.00
Success       [ratio]                  100.00%
Status Codes  [code:count]             200:50000
Error Set:
使用CPU数1で秒間5000リクエストを10秒
$ echo "GET http://localhost:8080/" | vegeta -cpus 1 attack -rate=5000 -duration=10s | tee /tmp/vegeta_result.bin
$ vegeta report /tmp/vegeta_result.bin
Requests      [total, rate]            50000, 4999.50
Duration      [total, attack, wait]    10.003982727s, 10.000994202s, 2.988525ms
Latencies     [mean, 50, 95, 99, max]  5.340581ms, 182.028µs, 18.882526ms, 126.656443ms, 226.487035ms
Bytes In      [total, mean]            249505, 4.99
Bytes Out     [total, mean]            0, 0.00
Success       [ratio]                  99.80%
Status Codes  [code:count]             0:99  200:49901
Error Set:
Get http://localhost:8080/: dial tcp 0.0.0.0:0->127.0.0.1:8080: socket: too many open files
Get http://localhost:8080/: net/http: timeout awaiting response headers
■初期起動ワーカー数の指定
指定数ごとに3回ずつ実行してみる。
※指定した秒間リクエスト数1000に対して「ワーカー数1500 -> 500 -> 指定なし(=10)」の順で3回。
結果としては最初から十分なワーカー数を指定しておいた方が、適切に負荷がかかっているのでは?と思われるが、これだけでは判断つかず。
ワーカーの指定数が少なくとも、実際には -rate で指定したリクエスト数を維持するためにツール側がワーカーは自動で増やすらしいので、それほど差は出ないのかな。
コマンド実行例
$ echo "GET http://localhost:8080/" | vegeta attack -rate=1000 -duration=5s -workers 1500 | tee /tmp/vegeta_result.bin
ワーカー数指定なし(=デフォルトの10)
Duration      [total, attack, wait]    4.999126126s, 4.998880268s, 245.858µs
Latencies     [mean, 50, 95, 99, max]  281.042µs, 183.576µs, 686.33µs, 1.467093ms, 10.033279ms

Duration      [total, attack, wait]    4.999139576s, 4.999033292s, 106.284µs
Latencies     [mean, 50, 95, 99, max]  257.028µs, 178.596µs, 638.012µs, 1.154227ms, 6.655713ms

Duration      [total, attack, wait]    4.999195111s, 4.999068189s, 126.922µs
Latencies     [mean, 50, 95, 99, max]  346.229µs, 259.688µs, 843.67µs, 1.796919ms, 10.177476ms
ワーカー数500
Duration      [total, attack, wait]    4.999721775s, 4.999139221s, 582.554µs
Latencies     [mean, 50, 95, 99, max]  496.042µs, 350.367µs, 1.124382ms, 3.840519ms, 9.333786ms

Duration      [total, attack, wait]    4.999613782s, 4.999043771s, 570.011µs
Latencies     [mean, 50, 95, 99, max]  420.453µs, 305.086µs, 942.787µs, 2.714533ms, 5.462021ms

Duration      [total, attack, wait]    4.999031497s, 4.998815478s, 216.019µs
Latencies     [mean, 50, 95, 99, max]  481.2µs, 343.804µs, 1.133189ms, 3.191827ms, 9.311425ms
ワーカー数1500
Duration      [total, attack, wait]    5.000674496s, 4.999160149s, 1.514347ms
Latencies     [mean, 50, 95, 99, max]  582.711µs, 370.119µs, 1.375954ms, 5.454036ms, 17.685545ms

Duration      [total, attack, wait]    5.000896479s, 4.99925214s, 1.644339ms
Latencies     [mean, 50, 95, 99, max]  457.473µs, 339.288µs, 976.16µs, 2.584329ms, 12.987177ms

Duration      [total, attack, wait]    5.001869506s, 5.000088669s, 1.780837ms
Latencies     [mean, 50, 95, 99, max]  512.086µs, 326.593µs, 1.087ms, 3.909842ms, 17.970555ms
■標準入力からでなくターゲットファイルから負荷のかけ先を取得
以下のようなファイルを用意。
GET http://localhost:8080/
echoでの指示を標準入力にしてからvegetaに渡すのではなく、-targets=request.txtとしてターゲットファイルを指定する形で実行。
$ vegeta attack -duration=5s -targets=request.txt | tee /tmp/vegeta_result.bin
結果。ちゃんと実行されている。
$ vegeta report /tmp/vegeta_result.bin
Requests      [total, rate]            250, 50.20
Duration      [total, attack, wait]    4.980640725s, 4.980149041s, 491.684µs
Latencies     [mean, 50, 95, 99, max]  423.15µs, 375.157µs, 696.669µs, 1.142931ms, 2.187108ms
Bytes In      [total, mean]            1250, 5.00
Bytes Out     [total, mean]            0, 0.00
Success       [ratio]                  100.00%
Status Codes  [code:count]             200:250
Error Set:
■HTTPヘッダーの指定
APIキー積まないと怒られるケースなどに。
main.go
以下のように、APIキーを積んでないと403返すよう修正。
func main() {
	e := echo.New()

	e.GET("/", func(c echo.Context) error {
+		if c.Request().Header.Get("API-KEY") != "3a193b40-9691-4f4f-841a-4417ff15e110" {
+			return c.JSON(http.StatusForbidden, nil)
+		}
		return c.JSON(http.StatusOK, "OK")
	})

	e.Logger.Fatal(e.Start(":8080"))
}
APIキー積まずに実行
GET http://localhost:8080/
$ vegeta attack -duration=3s -targets=request.txt | tee /tmp/vegeta_result.bin
全て 403 で失敗していることを確認。
$ vegeta report /tmp/vegeta_result.bin
Requests      [total, rate]            150, 50.33
Duration      [total, attack, wait]    2.980321793s, 2.980059168s, 262.625µs
Latencies     [mean, 50, 95, 99, max]  467.327µs, 403.329µs, 790.551µs, 1.32436ms, 3.608084ms
Bytes In      [total, mean]            750, 5.00
Bytes Out     [total, mean]            0, 0.00
Success       [ratio]                  0.00%
Status Codes  [code:count]             403:150
Error Set:
403 Forbidden
APIキー積んで実行
GET http://localhost:8080/
API-KEY: 3a193b40-9691-4f4f-841a-4417ff15e110
$ vegeta attack -duration=3s -targets=request.txt | tee /tmp/vegeta_result.bin
全て 200 OK で成功していることを確認。
$ vegeta report /tmp/vegeta_result.bin
Requests      [total, rate]            150, 50.33
Duration      [total, attack, wait]    2.980318685s, 2.980049257s, 269.428µs
Latencies     [mean, 50, 95, 99, max]  438.118µs, 358.716µs, 764.152µs, 1.231881ms, 2.604608ms
Bytes In      [total, mean]            750, 5.00
Bytes Out     [total, mean]            0, 0.00
Success       [ratio]                  100.00%
Status Codes  [code:count]             200:150
Error Set:
■出力先を指定
負荷結果はデフォルトで標準出力。
これまでの実行例では、標準出力結果を tee にパイプして別ファイルにも保存していた。
で、下記のように標準出力にもだらだらと流れていた。
$ vegeta attack -duration=3s -targets=request.txt | tee /tmp/vegeta_result.bin
w��Result��	Attack
                                SeqCode	Timestamp��LatencyBytesOutBytesInError
                                                                                                         Body

 〜〜 省略 〜〜
-outputを指定すると、パイプせず別ファイルに負荷結果を出力できる。
$ vegeta attack -duration=7s -targets=request.txt -output=/tmp/vegeta_result.bin
$
$ vegeta report /tmp/vegeta_result.bin
Requests      [total, rate]            350, 50.14
Duration      [total, attack, wait]    6.980952182s, 6.979981729s, 970.453µs
Latencies     [mean, 50, 95, 99, max]  786.457µs, 782.618µs, 1.054495ms, 1.197944ms, 2.624248ms
Bytes In      [total, mean]            1750, 5.00
Bytes Out     [total, mean]            0, 0.00
Success       [ratio]                  100.00%
Status Codes  [code:count]             200:350
Error Set:
■タイムアウト値を設定
リクエスト処理時間に 550 ミリ秒の遅延を入れてみる。
  〜〜 省略 〜〜

	e.GET("/", func(c echo.Context) error {
		if c.Request().Header.Get("API-KEY") != "3a193b40-9691-4f4f-841a-4417ff15e110" {
			return c.JSON(http.StatusForbidden, nil)
		}
+		time.Sleep(550 * time.Millisecond)
		return c.JSON(http.StatusOK, "OK")
	})

  〜〜 省略 〜〜
まず、タイムアウト指定なしで実行。
$ vegeta attack -targets=request.txt -output=/tmp/vegeta_result.bin -rate=100 -duration=3s
$
$ vegeta report /tmp/vegeta_result.bin
 〜〜 省略 〜〜
Success       [ratio]                  100.00%
Status Codes  [code:count]             200:300
Error Set:
すべて成功。
ついで、 500 ミリ秒でタイムアウトする設定で実行。
$ vegeta attack -targets=request.txt -output=/tmp/vegeta_result.bin -rate=100 -duration=3s -timeout=500ms
$
$ vegeta report /tmp/vegeta_result.bin
 〜〜 省略 〜〜
Success       [ratio]                  0.00%
Status Codes  [code:count]             0:300
Error Set:
Get http://localhost:8080/: net/http: timeout awaiting response headers
すべてタイムアウトで失敗。
レポートオプション
■負荷結果の見方
コマンドオプション実行事例では軽くスルーしていたけど、そもそもの負荷結果の見方。
個人的にパッとわかりづらいかと思う部分のみ。
それ以外は下記参照。
https://github.com/tsenart/vegeta#report-command
毎秒 5000 リクエストを 10秒間実行。
$ vegeta attack -targets=request.txt -output=/tmp/vegeta_result.bin -rate=5000 -duration=10s
結果。
$ vegeta report /tmp/vegeta_result.bin
Requests      [total, rate]            50000, 5000.09
Duration      [total, attack, wait]    9.999930611s, 9.999811804s, 118.807µs
Latencies     [mean, 50, 95, 99, max]  189.022µs, 101.676µs, 304.945µs, 2.29017ms, 20.890218ms
Bytes In      [total, mean]            250000, 5.00
Bytes Out     [total, mean]            0, 0.00
Success       [ratio]                  100.00%
Status Codes  [code:count]             200:50000
Error Set:
Requests
毎秒 5000 リクエストを 10秒間実行だから、全 50000 リクエストは当然として、rateは、実際に毎秒何リクエストできたかを示すらしい。
Requests [total, rate] 50000, 5000.09
Latencies
”レイテンシー”は待ち時間。リクエストに対するレスポンスが読み取られるのにかかる時間とのこと。
(厳密にどこからどこまでかがちょっとわからない・・・)
meanは全リクエストのレスポンス待ち時間の平均。
50、95、99は、それぞれの攻撃の全リクエストのレスポンス待ち時間の50、95、99パーセンタイル(※)。
maxは全リクエスト中、最大だったレスポンス待ち時間。
※「パーセンタイル」について。
例えば、“90パーセンタイル”とは、負荷テスト結果を並べ、その中の 90% が合格になるラインのこと。
逆に言うと、結果のうち、結果の悪かった(つまり、レスポンス待ち時間が最もかかったもの)から 10%を除外して、残った中の最悪値。
【参考】https://www.atmarkit.co.jp/ait/articles/1201/06/news121.html
う〜ん、「パーセンタイル」については、わかったようなわからないような・・・。
Latencies [mean, 50, 95, 99, max] 189.022µs, 101.676µs, 304.945µs, 2.29017ms, 20.890218ms
■レポート表示形式をJSONに変更
主に結果をプログラム等で解析する用途。
$ vegeta report -type=json /tmp/vegeta_result.bin | jq .
{
  "latencies": {
    "total": 9451100882,
    "mean": 189022,
    "50th": 101676,
    "95th": 304945,
    "99th": 2290170,
    "max": 20890218
  },
  "bytes_in": {
    "total": 250000,
    "mean": 5
  },
  "bytes_out": {
    "total": 0,
    "mean": 0
  },
  "earliest": "2019-05-10T08:46:57.100260544+09:00",
  "latest": "2019-05-10T08:47:07.100072348+09:00",
  "end": "2019-05-10T08:47:07.100191155+09:00",
  "duration": 9999811804,
  "wait": 118807,
  "requests": 50000,
  "rate": 5000.09409977092,
  "success": 1,
  "status_codes": {
    "200": 50000
  },
  "errors": []
}
■レポート表示形式をヒストグラムに変更
ヒストグラムの見栄え的によくなるよう、リクエスト処理時間にランダム性を持たせる。
package main

import (
	"fmt"
+	"math/rand"
	"net/http"
	"os"
+	"time"

	"github.com/labstack/echo"
)

func main() {
	e := echo.New()
+	rand.Seed(time.Now().UnixNano())

	e.GET("/", func(c echo.Context) error {
+		t := rand.Intn(500)
+		time.Sleep(time.Duration(t) * time.Millisecond)
		return c.JSON(http.StatusOK, "OK")
	})

	e.Logger.Fatal(e.Start(":8080"))
}
十分さばける程度の秒間3000リクエストを10秒間実施。
$ vegeta attack -targets=request.txt -output=/tmp/vegeta_result.bin -rate=3000 -duration=10s
通常の結果表示。
$ vegeta report /tmp/vegeta_result.bin
Requests      [total, rate]            30000, 3000.08
Duration      [total, attack, wait]    10.490030737s, 9.999719675s, 490.311062ms
Latencies     [mean, 50, 95, 99, max]  251.688088ms, 251.929484ms, 475.514383ms, 495.326804ms, 505.291259ms
Bytes In      [total, mean]            150000, 5.00
Bytes Out     [total, mean]            0, 0.00
Success       [ratio]                  100.00%
Status Codes  [code:count]             200:30000
Error Set:
ランダム値で0〜500msまでのスリープを入れたので、おおよそ50msおきのグラフにしてみる。
$ vegeta report -type='hist[0ms,10ms,50ms,100ms,150ms,200ms,250ms,300ms,350ms,400ms,450ms,500ms,550ms]' /tmp/vegeta_result.bin
Bucket           #     %       Histogram
[0s,     10ms]   550   1.83%   #
[10ms,   50ms]   2396  7.99%   #####
[50ms,   100ms]  2977  9.92%   #######
[100ms,  150ms]  3024  10.08%  #######
[150ms,  200ms]  2965  9.88%   #######
[200ms,  250ms]  2970  9.90%   #######
[250ms,  300ms]  2892  9.64%   #######
[300ms,  350ms]  3000  10.00%  #######
[350ms,  400ms]  3051  10.17%  #######
[400ms,  450ms]  3068  10.23%  #######
[450ms,  500ms]  3103  10.34%  #######
[500ms,  550ms]  4     0.01%
[550ms,  +Inf]   0     0.00%
いい感じにバラけてる。
■結果をHTML形式で表示
スリープ指定範囲を0ms〜1000msにする。
 〜〜 省略 〜〜
	e.GET("/", func(c echo.Context) error {
+		t := rand.Intn(1000)
		time.Sleep(time.Duration(t) * time.Millisecond)
		return c.JSON(http.StatusOK, "OK")
	})
 〜〜 省略 〜〜
秒間1000リクエストを10秒間実施。
$ vegeta attack -targets=request.txt -output=/tmp/vegeta_result.bin -rate=1000 -duration=10s
通常の結果表示。
$ vegeta report /tmp/vegeta_result.bin
Requests      [total, rate]            10000, 1000.09
Duration      [total, attack, wait]    10.973673508s, 9.999065491s, 974.608017ms
Latencies     [mean, 50, 95, 99, max]  499.535009ms, 498.586832ms, 946.167709ms, 988.339987ms, 1.00029709s
Bytes In      [total, mean]            50000, 5.00
Bytes Out     [total, mean]            0, 0.00
Success       [ratio]                  100.00%
Status Codes  [code:count]             200:10000
Error Set:
結果をHTMLにプロット。
$ vegeta plot /tmp/vegeta_result.bin > /tmp/vegeta_plot.html
ブラウザで表示。
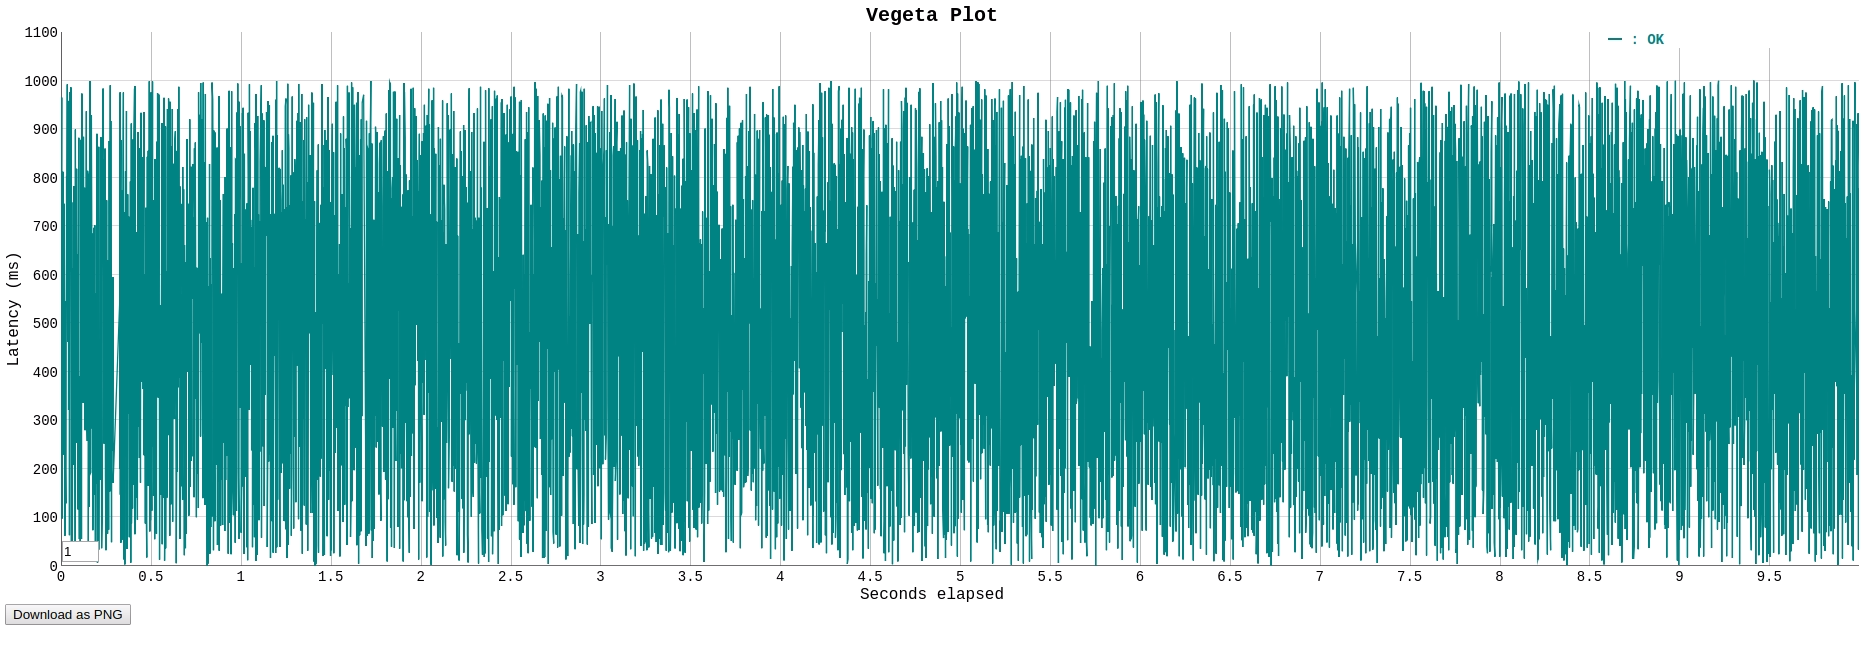
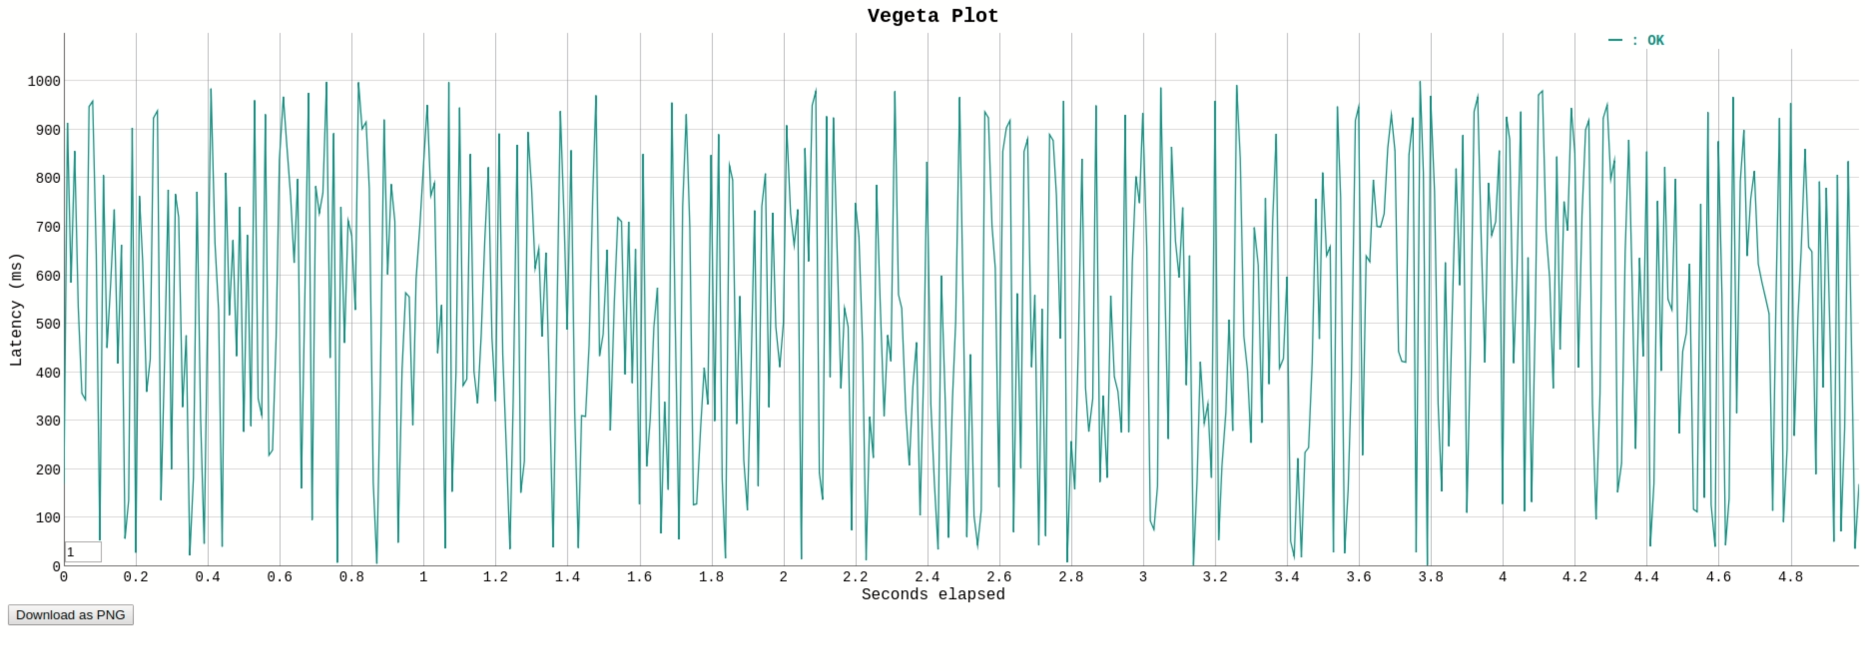
ちょっと密集しすぎている。
たとえば、秒間100リクエストを5秒実施の場合だと、こんな感じ。
まとめ
他にもいろんなことができるのは公式を見るとわかるけど、ひとまず今回はここまで。
以下、試したもののまとめ。
Usage: vegeta [global flags] <command> [command flags]
*対象コマンド「-」の場合はglobal flags
| Option | 対象コマンド | 必須? | 未指定時の
デフォルト | 用途 | 例 | 備考 |
| --- | --- | --- | --- | --- | --- | --- | --- |
| -rate | attack | No | 50 | 毎秒リクエスト数の指定 | 100 | - |
| -duration | attack | No | 0 (=無限アタック) | 実施時間 | 10s | - |
| -cpus | - | No | 実際のCPU数 | 使用するCPU数 | 2 | - |
| -workers | attack | No | 10 | 初期起動ワーカー数 | 100 | - |
| -targets | attack | No | 標準入力 | 負荷をかける先などを指定するファイル | request.txt | - |
| -output | attack | No | 標準出力 | 負荷結果出力先 | result.bin | - |
| -timeout | attack | No | 0(=タイムアウトしない) | タイムアウト値 | 500ms | - |
| -type | report | No | text | 負荷結果出力フォーマット | json | - |