対象者
- 為替や株、仮想通貨などのデータは自力で取得できる
(始値、高値、安値、終値を含むデータ) - pandas の dataframe は自分で勉強する
- でも、パラボリックの計算式が難しすぎてソースコードに落とせない....
そんな方のための記事です
いい情報源がなかったので掲載してみました
前提
こんな状態のdataframeを用意しておいて下さい。
class FXBase():
    candles = None

# 頑張ってデータを取得して、FXBase.candlesに代入する
...

# 表示
FXBase.candles.head(10)
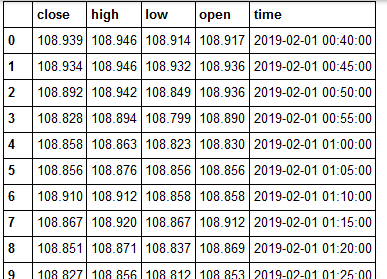
※ 私が用意したのは5分足のデータですが、別に5分足である必要はありません
※ len(FXBase.candles) > 200 を推奨します
計算式
難しすぎるので私が書くのは今のところやめておきます。。。。
計算式は、以下のサイトを参考にしました。
-
パラボリックSARをPythonで処理してMatplotlibでチャート乗せてみる(Python テクニカル指標シリーズ)
「大丈夫そうですね」って書いてあるけど、その上の画像を見ると、間違ってるっぽい。(偉そうなこと言ってすみません!)
でも説明がわかりやすく、とっかかりにちょうどよいです。
そういう意味ですごく参考になりました。 -
Excelでテクニカル計算 Parabolic SAR - ver1
ここに書いてあるエクセルの式を読み解いて、pythonコードに落とし込みました。
ここの説明が一番詳細で役立ちました。
MT4とは若干違うけれど、この計算式でも十分機能していたように感じます。 -
パラボリックSARの計算方法とZigZagの作成・詳細解説 - ver2 (20191013追記)
ここの説明が一番詳細でした。
20190202当時の私では理解できなかったため無視してしまっていましたが、MT4と全く同じparabolicSARを生成したかったら、この記事の通りにする必要がありそうです。
ソースコード - ver1
パラボリック計算処理
import pandas as pd
import seaborn
import matplotlib.pyplot as plt
import mplfinance.original_flavor as mpf

class Parabolic():
    INITIAL_AF = 0.02
    MAX_AF = 0.2

    def __parabolic_is_touched(self, bull, current_parabo, current_h, current_l):
        if bull and (current_parabo > current_l):
            return True
        elif not bull and (current_parabo < current_h):
            return True
        return False

    def re_calc(self):
        # 初期状態は上昇トレンドと仮定して計算
        bull = True
        acceleration_factor = Parabolic.INITIAL_AF
        extreme_price = FXBase.candles['high'][0]
        temp_sar_array = [FXBase.candles['low'][0]]

        for i, row in FXBase.candles.iterrows():
            current_high = FXBase.candles['high'][i]
            current_low  = FXBase.candles['low'][i]

            # レートがparabolicに触れたときの処理
            if self.__parabolic_is_touched(
                bull=bull,
                current_parabo=temp_sar_array[-1],
                current_h=current_high, current_l=current_low
            ):
                temp_sar = extreme_price
                acceleration_factor = Parabolic.INITIAL_AF
                if bull:
                    bull = False
                    extreme_price = current_low
                else:
                    bull = True
                    extreme_price = current_high

            else:
                if bull and extreme_price < current_high:
                    extreme_price = current_high
                    acceleration_factor = min(acceleration_factor + Parabolic.INITIAL_AF, Parabolic.MAX_AF)
                elif not bull and extreme_price > current_low:
                    extreme_price = current_low
                    acceleration_factor = min(acceleration_factor + Parabolic.INITIAL_AF, Parabolic.MAX_AF)
                temp_sar = temp_sar_array[-1] + acceleration_factor * (extreme_price - temp_sar_array[-1])

            if i == 0:
                temp_sar_array[-1] = temp_sar
            else:
                temp_sar_array.append(temp_sar)
        return temp_sar_array
計算処理の呼び出しと描画
# 計算
parabo = Parabolic()
SARs = parabo.re_calc()

# チャートの描画
figure, (axis1) = plt.subplots(nrows=1, ncols=1, figsize=(10,5), dpi=200)
mpf.candlestick2_ohlc(
    axis1,
    opens  = FXBase.candles.open.values,
    highs  = FXBase.candles.high.values,
    lows   = FXBase.candles.low.values,
    closes = FXBase.candles.close.values,
    width=0.6, colorup='#77d879', colordown='#db3f3f'
)
plot1 = axis1.scatter(FXBase.candles.index, SARs[:len(FXBase.candles)], marker='o', color='purple', s=10)

# グラフの見た目を整形
### X軸の見た目を整える
xticks_number  = 12 # 12本(60分)刻みに目盛りを書く 5分足だからこの設定にしてるよ
xticks_index   = range(0, len(FXBase.candles), xticks_number)
xticks_display = [FXBase.candles.time.values[i][11:16] for i in xticks_index] # 時間を切り出すため、先頭12文字目から取る

# axis1を装飾
plt.sca(axis1)
plt.xticks( xticks_index, xticks_display )
plt.legend([plot1], ['parabolic'], loc='upper right')
plt.show()
完成品
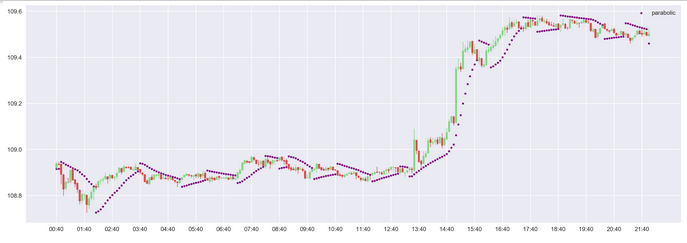
これでも、MT4で生成されるparabolicSARと大体一致するパラボリックを描画可能です
ソースコード - ver2 (20191013追記)
ver1だと、MT4と食い違う場合もちょこちょこ出てくることに、最近気が付きました。
というわけで、チャートとにらめっこしたり、下記参考サイトを見ながら修正した。
パラボリックSARの計算方法とZigZagの作成・詳細解説
この記事を参考に、「5. 仮計算したSARの調整」まで加味して実装したものが以下のソースコード。
※「6. SARの反転処理・その2」は実装できていない...
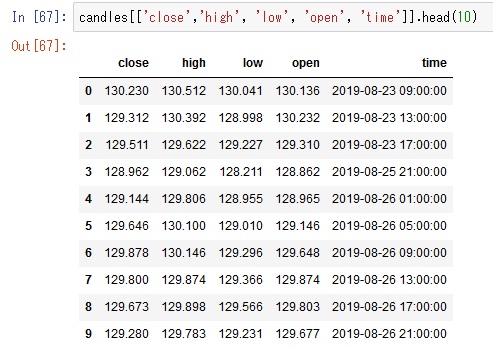
- 事前準備
まず、この状態のチャートデータを用意しておく。
# parabolicSAR生成
# # # # # # # # # # # # # # # # # # # # # # # # # # # #
#                   Parabolic SAR                     #
# # # # # # # # # # # # # # # # # # # # # # # # # # # #
INITIAL_AF = 0.02
MAX_AF = 0.2

def calc_next_parabolic(last_sar, ep, acceleration_f=INITIAL_AF):
    return last_sar + acceleration_f * (ep - last_sar)

def parabolic_is_touched(bull, current_parabo, current_h, current_l):
    if bull and (current_parabo > current_l):
        return True
    elif not bull and (current_parabo < current_h):
        return True
    return False

def calc_parabolic(candles):
    # 初期値
    acceleration_factor = INITIAL_AF
    # INFO: 初期状態は上昇トレンドと仮定して計算
    bull = True
    extreme_price = candles.high[0]
    temp_sar_array = [candles.low[0]]

    # HACK: dataframeのまま処理するより、to_dictで辞書配列化した方が処理が早い
    candles_array = candles.to_dict('records')
    for i, row in enumerate(candles_array):
        current_high = row['high']
        current_low = row['low']
        last_sar = temp_sar_array[-1]

        # レートがparabolicに触れたときの処理
        if parabolic_is_touched(
            bull=bull,
            current_parabo=last_sar,
            current_h=current_high, current_l=current_low
        ):
            temp_sar = extreme_price
            acceleration_factor = INITIAL_AF
            if bull:
                bull = False
                extreme_price = current_low
            else:
                bull = True
                extreme_price = current_high
        else:
            # SARの仮決め
            temp_sar = calc_next_parabolic(
                last_sar=last_sar, ep=extreme_price, acceleration_f=acceleration_factor
            )

            # AFの更新
            if (bull and extreme_price < current_high) \
                or not bull and extreme_price > current_low:
                acceleration_factor = min(
                    acceleration_factor + INITIAL_AF,
                    MAX_AF
                )

            # SARの調整
            if bull:
                temp_sar = min(
                    temp_sar, candles_array[i-1]['low'], candles_array[i-2]['low']
                )
                extreme_price = max(extreme_price, current_high)
            else:
                temp_sar = max(
                    temp_sar, candles_array[i-1]['high'], candles_array[i-2]['high']
                )
                extreme_price = min(extreme_price, current_low)

        if i == 0:
            temp_sar_array[-1] = temp_sar
        else:
            temp_sar_array.append(temp_sar)
    return pd.DataFrame(data=temp_sar_array, columns=['SAR'])

candles['SAR'] = calc_parabolic(candles)
# チャートの描画
figure, (axis1) = plt.subplots(nrows=1, ncols=1, figsize=(20, 10), dpi=200)
mpf.candlestick2_ohlc(
    axis1,
    opens  = candles.open.values,
    highs  = candles.high.values,
    lows   = candles.low.values,
    closes = candles.close.values,
    width=0.6, colorup='#77d879', colordown='#db3f3f'
)

# SAR描画
for key, column in candles[['SAR']].iteritems():
    axis1.scatter(x=candles[['SAR']].index, y=column.values, label=key, c='orangered', marker='d', s=2)

# グラフの見た目を整形
### X軸の見た目を整える
xticks_number = 12 # 12本(60分)刻みに目盛りを書く
xticks_index = range(0, len(candles), xticks_number)
xticks_display = [candles.time.values[i][:16] for i in xticks_index] # 時間を切り出すため、先頭12文字目から取る
plt.sca(axis1)
plt.xticks(xticks_index, xticks_display, rotation=30)

# 画像生成
plt.show()
完成品 - ver2
このコードで、このような結果になる
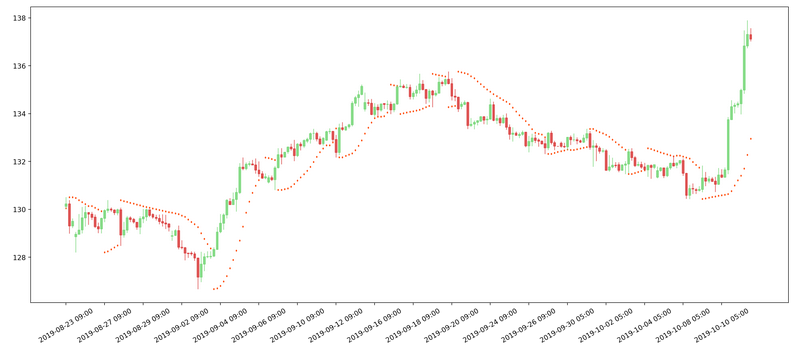
ひとまず、これで十分かな...(力尽きたorz)