概要
ハル移動平均(Hull Moving Average)というものをたまたま知ったので、Pythonを使って描画してみようと思い立って書いた記事。
ハル移動平均(Hull Moving Average)とは
Oandaの解説を見ていただきたい!
計算方法も上記記事に載っています!(^ワ^*)
動作環境
Google Colaboratory (2023/01/12 現在は動作します)
ソースコード
1. モジュール類
mplfinanceは、ローソク足を描画するために使います。
colaboratoryにはinstallされていないので、installしてからimportします。
!pip install -q mplfinance

import math  # 端数切捨てするために使う

import matplotlib.pyplot as plt
import mplfinance.original_flavor as mpf
import numpy as np
import pandas as pd
2. データ読み込み
以下のようなDataFrameを用意してください。
open high low close timeの5列があれば他はいらないです。
最低でも200行ぐらいあれば、いい感じに見えると思います。
df = pd.read_csv("/content/230112_GBP_JPY_500days_M15.csv")
df.head()

	open	high	low     close	volume	complete  time
0	151.100	151.134	151.092	151.130	89      True      2021-08-30 04:45:00
1	151.128	151.139	151.098	151.119	111     True      2021-08-30 05:00:00
2	151.116	151.120	151.070	151.079	100     True      2021-08-30 05:15:00
3	151.082	151.098	151.068	151.084	83      True      2021-08-30 05:30:00
4	151.086	151.090	151.070	151.089	117     True      2021-08-30 05:45:00
3. ハル移動平均の計算
前記Oandaの記事を読むと、加重ハル移動平均を計算するためにはWMA(加重移動平均)を計算する必要があるようですね。
WMAの計算方法は、以下の記事を参考にさせていただきました。
# ---------------------------------------------------------
# ハル移動平均の計算処理
# ---------------------------------------------------------
def wma_of(price_series: pd.Series, window_size: int = 9) -> pd.Series:
    """
    指定されたwindow_sizeのwma(加重移動平均)を計算

      ※記事を参考にして書いた関数
    """
    def wma(rolled_price_series: pd.Series) -> pd.Series:
        """
        rollingされた窓分だけのseriesに対する処理
        """
        weight = np.arange(len(rolled_price_series)) + 1
        wma = np.sum(weight * rolled_price_series) / weight.sum()
        return wma

    wma_result: pd.Series = price_series.rolling(window_size).apply(wma, raw=True).round(3)
    return wma_result


def hull_ma(close_series: pd.Series, window: int = 9) -> pd.Series:
    """
    ハル移動平均を計算
    """
    # n / 2
    half_of_window_size: int = window // 2
    # n の平方根
    sqrt_of_window_size: int = math.floor(np.sqrt(window))

    # A: n÷2日WMAを2倍したもの
    double_wma_of_half_window_size: pd.Series = wma_of(close_series, half_of_window_size) * 2
    # B: n日WMA
    wma_of_window_size: pd.Series = wma_of(close_series, window)

    # A - Bの結果を、nの平方根日WMAで均す
    return wma_of(
        double_wma_of_half_window_size - wma_of_window_size,  # A-B
        sqrt_of_window_size
    )
上記処理の動作確認をしておきます。
試しにwindow_sizeを20本にして算出してみます。
hull_ma_20: pd.Series = hull_ma(df["close"], 20)
hull_ma_20

0            NaN
1            NaN
2            NaN
3            NaN
4            NaN
          ...
34232    160.080
34233    160.097
34234    160.112
34235    160.119
34236    160.120
Name: close, Length: 34237, dtype: float64
計算するだけで良ければ、ここまでで終了ですよ。
4. 描画
本質的ではないんですけど、ここが一番手間がかかりますよね。
せっかくなので、Oandaの記事に表示されていたように、上昇時と下降時の色を変えておきましょう。
# 量が多すぎると描画時間がかかりすぎるので、末尾300行のみを抽出しておく
target_df = df.iloc[-300:]

hull_ma_20: pd.Series = hull_ma(df["close"], 20)
target_hull_ma = hull_ma_20.iloc[-300:]


# ---------------------------------------------------------
# ローソク足の描画
# ---------------------------------------------------------
figure, (axis1) = plt.subplots(1, 1, figsize=(20,10))
mpf.candlestick2_ohlc(
    axis1,
    opens=target_df["open"],
    highs=target_df["high"],
    lows=target_df["low"],
    closes=target_df["close"],
    width=0.6,
    colorup="#77d879",
    colordown="#db3f3f",
)


# ---------------------------------------------------------
# ハル移動平均の描画
# ---------------------------------------------------------
# 1つ前の値より大きければTrue、小さければFalseが入っているSeriesを作成
hull_up_index: pd.Series = target_hull_ma > target_hull_ma.shift(1)

# ハル移動平均のseriesを up中 と down中 それぞれのseriesに分離して描画
hull_ma_only_up = target_hull_ma.copy()
hull_ma_only_down = target_hull_ma.copy()
hull_ma_only_up[~hull_up_index] = None  # up中の値を残し、down中の値を None で置き換え
hull_ma_only_down[hull_up_index] = None  # down中の値を残し、up中の値を None で置き換え

plt.plot(target_df["time"], hull_ma_only_up, "-", label="hull_ma_20_up", linewidth=2)
plt.plot(target_df["time"], hull_ma_only_down, "-", label="hull_ma_20_down", linewidth=2)


# ---------------------------------------------------------
# 目盛り類と凡例情報の描画
# ---------------------------------------------------------
def prepare_xticks(sr_time) -> np.ndarray:
    """
    xticks(x軸の目盛り)を全部表示すると目障りなので、量を24分の1個にするための間引き処理
    """
    num_break_xticks_into = 24
    xticks_size = int(len(sr_time) / num_break_xticks_into)
    xticks_index = range(0, len(sr_time), xticks_size) if xticks_size > 0 else []
    return xticks_index

xticks = prepare_xticks(target_df["time"])
plt.xticks(xticks, rotation=75)
plt.xlabel("time")
plt.ylabel("price")
plt.legend()


# ---------------------------------------------------------
# 上記描画対象をcolaboratory上に表示
# ---------------------------------------------------------
plt.show()
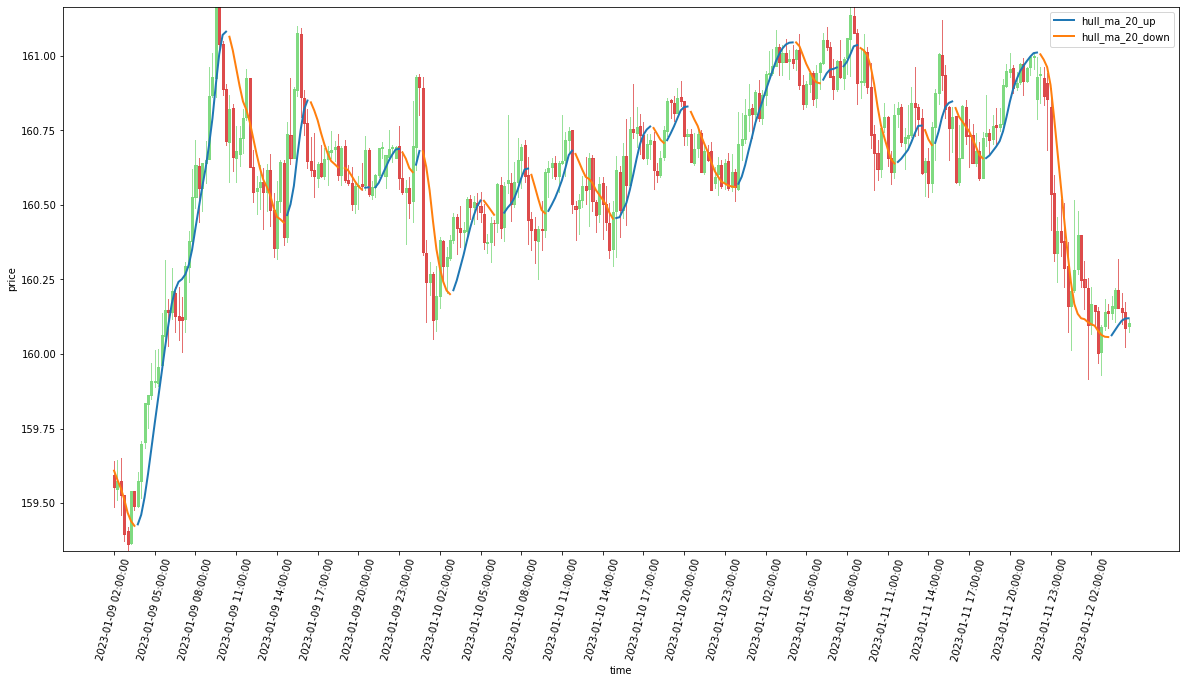
でけたヾ(*´∀`*)ノ
ハル移動平均の描画については、上昇中と下降中で色を変えてるので、ソースコードがちょっとややこしいですね。
でも、普通に描画するだけなら描画処理を記事に書く旨味があまり無いと思ったので、敢えて色を変えてみました。
終わりに
ハル移動平均やWMAの計算方法に間違いがあったら、ご指摘いただけるとありがたいです!
参考資料
Hull Moving Averageとは
Oandaによる解説記事
WMA(加重移動平均)の計算方法
こちらの記事を参考にしました
matplotlib使い方
公式ドキュメント
ハル移動平均の上昇/下降の切り替わりポイントで色を変えるために
matplotlib.pyplot.plot関数では、Noneが描画されないことが以下の記事で紹介されています