※追記
@a-know さんよりコメント頂いた通り、mackerel-agentの新しい方だとcustom_identifierを使えばカスタムメトリックとして投稿出来ました!
このラッパーの意味がもう(ry
ただカスタムメトリックとして投稿するには、mackerel-agentが動いてる監視用サーバが必要になるので、現状serverlessで監視しようとすると、このラッパーを使うしかないと思います。
MackerelでAuroraを監視する際に困ったこと
- 例えばMackerelでAuroraの監視をするとき、Mackerel AWS Integrationを使おうってなります
- しかし、現状Mackerel AWS Integrationは**Auroraのメトリックに対応してないです**
- (「いやいや対応してるよ!」「この方法でいけるぜ!」があれば是非!)
じゃぁ監視用サーバ建てるか
-
general:watch-serverっていう監視用のサーバ建てて、mackerel-plugin-aws-rds -engine=auroraコマンドを発行させます -
そうすると、監視用サーバのサービス名とホスト情報としてメトリックスが集約されます
-
example.comってサービス名のAuroraなのに、general:watch-serverにメトリックスが表示されて非常に見づらい -
追記:
custom_identifierを使えば別サービス名のカスタムメトリックとして表示させれます -
その際は
custom_identifierがついたホストを事前にcurlか何かで作ってあげてください
mackerel-cast-service-metricというのをGoで作った
使い方
①releaseから対応してるOSをダウンロードして解凍 or build
- READMEを見てもらえば大体わかるかなと思いますが、こちらは日本語版で紹介
②config.toml書く
- 今回はテストでmackerel-plugin-linux、mackerel-plugin-uptimeを打たせます
- api_keyにmackerelのAPI_Keyを打ち込んでください
- cmdがmackerel-agent-pluginのコマンドです
- service_nameが、Servicesに登録されてる部分
- metric_nameは表示するメトリックの名前の先頭に何かつけたい時つけてください
$ vim /tmp/config.toml
api_key = "xxxxxxxxxxxxx"

[[rule]]
cmd = "mackerel-plugin-linux"
service_name = "web"
metric_name = ""

[[rule]]
cmd = "mackerel-plugin-uptime"
service_name = "web"
metric_name = "test"
③実行
./mackerel-cast-service-metric -c /tmp/config.toml
④結果
-
Services->service_nameで設定したやつ->サービスメトリックでご覧ください
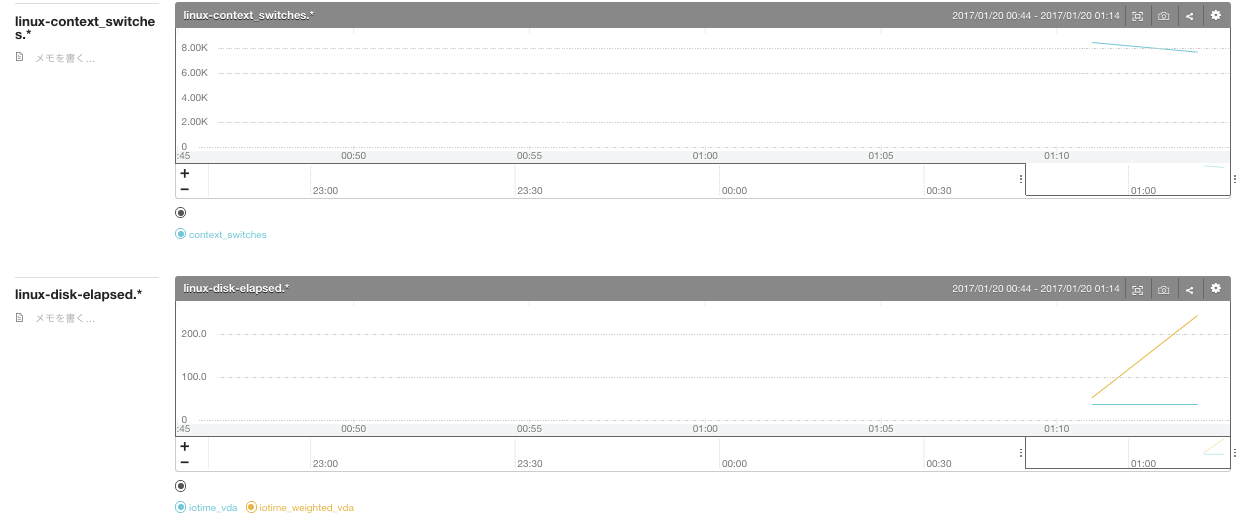
mackerel-plugin-linux
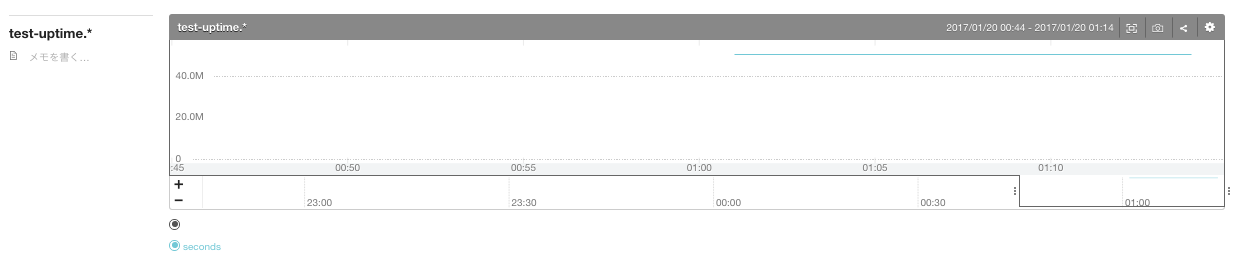
mackerel-plugin-uptime
- 先頭にtestってついてる
最後に
- これをlambdaでコマンド発行し、監視させようと実験中です。Serverless!