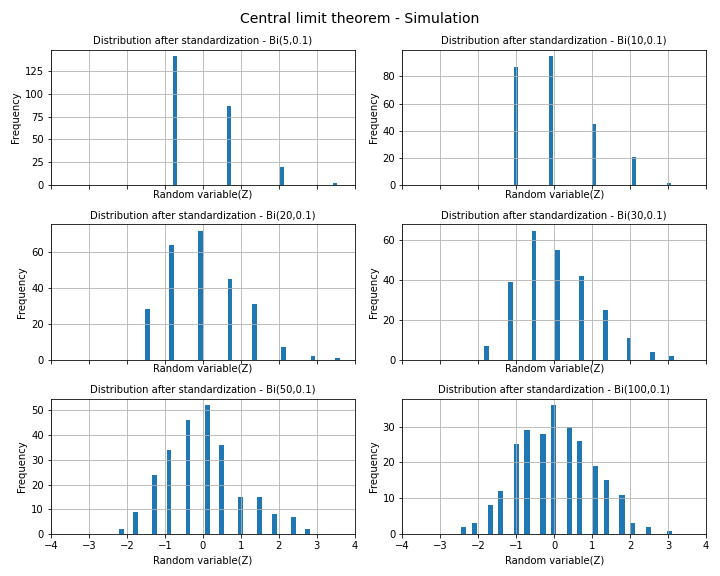
東京大学出版会から出版されている「統計学入門(基礎統計学Ⅰ)」で解説されている「中心極限定理」について、コンピューター・シミュレーションしている結果が掲載されています。
※ 「大数の法則」のシミュレーションはこちらを参照ください。
書籍では二項分布と指数分布によるシミュレーション結果が掲載されていますが、今回は二項分布についてシミュレーションしてみたので掲載しておきます。
■ Pythonサンプルコード
# 統計学入門(東京大学出版会)の「中心極限定理」シミュレーション
# [0,1)の乱数を発生させ、0.1未満なら成功(1)、0.1以上なら失敗(0)とする。
# 繰り返し回数n(5,10,20,30,50,100)の二項乱数を250個生成し、標準化した確率分布が
# 正規分布に法則収束するかシミュレーションする。
import numpy as np
import pandas as pd

n_list = [5, 10, 20, 30, 50, 100] # ベルヌーイ試行の回数(n)
N = 250 # 試行回数
p = 0.1 # ベルヌーイ試行の成功確率
z = np.array([]) # 標準化後の確率変数値の格納用リスト
E_list, V_list = [], [] # 平均値、分散の格納用リスト
E_t_list, V_t_list = [], [] # 期待値(理論値)、分散(理論値)の格納用リスト
x = {} # データ可視化用ディクショナリ

for n in n_list:
    r_n = np.random.rand(N, n) # 250×n の一様分布を生成
    r_n = np.vectorize(lambda x: 1 if x<p else 0)(r_n)
    r = np.sum(r_n, axis=1)
    E = np.sum(r)/N # 平均値
    V = np.sum((r-r.mean())*(r-r.mean()))/N # 分散
    E_t = n*p # 期待値(理論値)
    V_t = n*p*(1-p) # 分散(理論値)
    #z = (r-E_t)/np.sqrt(V_t) # 標準化(理論値)
    z = (r-E)/np.sqrt(V) # 標準化

    E_list.append(E)
    E_t_list.append(E_t)
    V_list.append(V)
    V_t_list.append(V_t)
    x[n] = z

fig, axes = plt.subplots(3, 2, figsize=(10, 8), sharex=True, sharey=False)

# グラフ出力
for ax, n in zip(axes.ravel(), n_list):
    ax.set_title('Distribution after standardization - Bi('+str(n)+','+str(p)+')', fontsize = 10)
    ax.set_xlabel('Random variable(Z)')
    ax.set_ylabel('Frequency')
    ax.set_xlim(-4, 4)
    ax.grid()
    ax.hist(x[n], bins=40)
fig.suptitle('Central limit theorem - Simulation', fontsize = 14)
fig.tight_layout()
plt.show()

# 平均、分散出力
E_V = []
E_V.append(E_list)
E_V.append(E_t_list)
E_V.append(V_list)
E_V.append(V_t_list)
df = pd.DataFrame(E_V, columns=n_list, index=['平均','平均(理論値)','分散','分散(理論値)'])
display(df)
■ 結果
■ まとめ
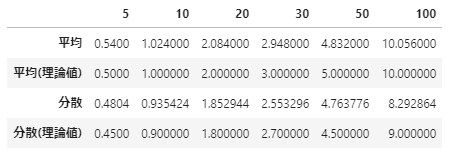
繰り返し回数を5回→10回→・・・→100回と増加させるに従い、正規分布のような形状になっていくことが確認できました。書籍に倣い平均と分散も出力させましたが、こちらもほぼ理論値と等しい値がでています。確率論としては数学的に証明されている定理ですが、二項分布を模したデータからも実際に正規分布が得られることも感覚として理解できました。

