Jupyter上で使えるプロットを自分で作って遊べないか試してみました。
ゴミでもなんでもアウトプットしていくべきとのことで、大したことのないものですが進めていきます。
plotlyとか既に色々選択肢がありますが、勉強目的と、自分でカスタマイズなどもできるように、車輪の再発明をしていきます。
使うjsライブラリ
インタラクティブ且つ色々アニメーションさせたりも考えて、D3.jsをPython側から扱っていく方向で進めます。後は作業中は個別のモジュール単位などで実施し、定期的に全体のテストを流していく等すればテスト時間はそこまで気にならなくなりそうです。
(D3.js自体は以前記事にしているのでそちらも良ければ : SVGとD3.jsの入門まとめ)
jsライブラリの読み込みはどうやるの?
べたでjsやHTMLを書いたりする分にはIPython.displayパッケージ内の関数やクラスを使っていけばJupyter上で色々できますが、外部のjsファイルなどを対象としたい場合はどうすればいいのでしょう。
Jupyter上で、HTMLやdisplayメソッドを組み合わせてscriptタグでsrc指定したくらいだと、エラーで怒られるようです。
他の方のライブラリでマジックコマンドでJupyter上でD3.jsを扱えるようにするものがありましたが、今回はJupyter上で直接D3.jsを扱うのではなく、.pyファイルを経由する形でライブラリで色々やりたいところです。
調べたところ、requirejsを使う形でJupyterで読み込めるとの記事があったため、そちらを利用する形にしました。
%%html
<script>
    requirejs.config({
        paths: {
            'd3': ['https://d3js.org/d3.v4.min'],
        },
    });
</script>
※minの後に.jsといった拡張子は付けない形で指定します。
※v4のバージョンの個所は他のものを使う際には調整してください。
後は、使いたいタイミングでrequire(['d3'], function(d3) {...といった記述をすることで、D3.jsがJupyter上で使えます。
%%html
<svg id="test-svg" width="100" height="100">
</svg>
<script>
    require(['d3'], function(d3) {
        d3.select("#test-svg")
            .append("rect")
            .attr("width", "100")
            .attr("height", "100")
            .attr("fill", "#ff0000");
    });
</script>

※htmlのマジックコマンドで記述したましたが、IPython.display.display関数とIPython.display.HTMLを組み合わせて、.py上から実行してもちゃんとJupyter上で表示されます。
テストどうしようか問題
フロントのテストに近いような印象ですが、Jupyter上で動作することを目的とするため、普通のバックエンド側の単体テストなどと比べると少し厄介です。
手動でのテストに頼る形でもいいのかもしれませんが、50とか100とかにプロットの種類がなってくると少ししんどい気配があります。
細かいアニメーションなどは目に頼る必要がありますが、それ以外のあまりテストを書く負担が重くなく、且つ書いてあると安心感が出てくる費用対効果が高そうなところはJupyterなどが絡む個所でもテストを書く形で進めます。
Jupyterの起動
まずは、Jupyterを起動させないといけないため、noseのテストランナーのラッパー的なモジュールを用意しました。
そのモジュール内で、別のプロセスでJupyterを起動するようにしました。
起動コマンドの--no-browserオプションで、ブラウザを起動せずにJupyterを起動できます。後で触れますが、selenium側で別途ブラウザを立ち上げるので、ここではブラウザの起動はしない形で設定しています。
また、--portでテスト用のJupyterのポートを指定しています。通常は8888が使われ、8888が使用済みであれば8889...といった具合にポート番号が割り振られていくので、それらとテスト用のJupyterで番号が被らないように設定しています。
import os
import multiprocessing as mp
import subprocess as sp
import time

...

def run_jupyter_process():
    """
    Start Jupyter process for testing.
    """
    os.system(
        'jupyter notebook --no-browser --port={jupyter_test_port} &'.format(
            jupyter_test_port=JUPYTER_TEST_PORT
        ))


...

    jupyter_process = mp.Process(target=run_jupyter_process)
    jupyter_process.start()
また、別のプロセスにしないとJupyter起動のコマンドで処理が止まってしまう(Ctrl + CなどでJupyterを止めないと次に進まない)のでmultiprocessingモジュールを利用しています。
ただ、いつ起動が終わるのかが見えないので、起動が終わったかどうかをチェックする必要があります。以下のようなコマンドで、起動が終わって動いているJupyterの一覧が表示できるので、そのリストの中に指定したテスト用のポートのJupyterが存在するかどうかをチェックし、存在する状態になったタイミングでnoseのテストに移るようにwhile文で制御します。
$ jupyter notebook list
以下のようにポートやトークンなどを含めたリストが表示されます。
Currently running servers:
http://localhost:8888/?token=27fc5d92e60184655a145a6ef723ff5f6349571b3cd0cb1e :: C:\Users\
def is_jupyter_started():
    """
    Get the boolean value as to whether Jupyter for testing has
    been started or not.

    Returns
    -------
    result : bool
        If it is started this function will returns True.
    """
    out = sp.check_output(
        ['jupyter', 'notebook', 'list'])
    out = str(out)
    is_in = str(JUPYTER_TEST_PORT) in out
    if is_in:
        return True
    return False

...

    while not is_jupyter_started():
        time.sleep(1)
また、テストが終わった後に、起動したJupyterを止めないと、ポート番号がどんどんずれていったり、メモリを無駄に消費したりと好ましくありません。
アクセス時にもポート番号がずれずに固定のものだと制御が楽なので、テスト前と終わったタイミングでテスト用のポートのJupyterが起動していれば止めるようにしておきます。
以下のようなフォーマットのコマンドで任意のJupyterを止めることができます。
$ jupyter notebook stop {ポート番号}
def stop_jupyter():
    """
    Stop Jupyter of the port number used in the test.
    """
    os.system('jupyter notebook stop {jupyter_test_port}'.format(
        jupyter_test_port=JUPYTER_TEST_PORT
    ))

...

    stop_jupyter()
    jupyter_process.terminate()
テスト長くない?問題
テスト時にJupyterを起動させる都合、ちょっとテストが終わるまで長くなります。
一部のモジュールだけテストしたい、といったケースでも1分かかったりします。
仕事だと部分的なテストは3秒くらいあれば起動から終わりまで通るのでそれらと比べると少し辛いところです。
基本的にテストを流している間もぼーっとしているのは非効率なので、作業しつつ終わったら通知が来るようにしておきます。Win10環境で作業しているので、Windows 10 Toast NotificationsというPythonライブラリを使わせていただきました。
これで、テストが終わった際に画面右下に通知が表示されます。

インストール :
$ pip install win10toast==0.9
また、テストにはnoseライブラリを使っていますが、noseで引数に--with-xunitと--xunit-fileを指定することで、指定のパスにテストの実行結果をXMLで保存してくれるようになるようです。XML内に、テスト全体の実行件数や失敗件数、各テストの処理時間が保存されます。
XMLのパース用に、Pythonのxmlモジュールを使って値を取っていきます。
import xml.etree.ElementTree as ET
...
from win10toast import ToastNotifier
import nose
...
def run_nose_command(module_name):
    """
    Execute the test command with the Nose library, and
    obtain the number of execution tests and the number of
    failure tests.

    Parameters
    ----------
    module_name : str
        Name of the module to be tested. Specify in a form
        including a path. Omit extension specification.
        If an empty character is specified, all tests are
        targeted.

    Returns
    -------
    test_num : int
        Number of tests executed.
    error_num : int
        Number of errors.
    failures_num : int
        Number of tests failed.
    """
    xml_path = 'log_test.xml'
    nose_command = 'nosetests'
    if module_name != '':
        nose_command += ' %s' % module_name
    nose_command += ' --with-xunit --xunit-file={xml_path} -s -v'.format(
        xml_path=xml_path
    )
    os.system(nose_command)
    with open(xml_path, 'r') as f:
        test_xml = f.read()
        xml_root_elem = ET.fromstring(text=test_xml)
    test_num = int(xml_root_elem.attrib['tests'])
    error_num = int(xml_root_elem.attrib['errors'])
    failures_num = int(xml_root_elem.attrib['failures'])
    return test_num, error_num, failures_num
...
    test_num, error_num, failures_num = run_nose_command(
        module_name=module_name)
...
    toast_msg = '----------------------------'
    toast_msg += '\ntest num: %s' % test_num
    toast_msg += '\nerror num: %s' % error_num
    toast_msg += '\nfailures num: %s' % failures_num
    toast_notifier = ToastNotifier()
    toast_notifier.show_toast(
        title='The test is completed.',
        msg=toast_msg,
        duration=5)
これでテスト終了時に通知が飛んでくるようになります。音も鳴るのでよそ見していても安心。
お好みでSlackなどに調整するといいと思われます。というか、なんとなくお試しでこれ使ってみたけれど、普通にSlackでいいよね。
後は作業中は個別のモジュール単位などで実施し、定期的に全体のテストを流していく等すればテスト時間はそこまで気にならなくなりそうです。
また、テストのコマンドの引数で、Jupyterの起動をスキップするかどうかの指定を受け入れるようにも調整しました(1つの関数のみのテストなどで、Jupyterを使わない場合など)。
遊びなので本格的なCI的なところまでは対応しませんが、ひとまずは個人で進めるにはこの程度で良さそうです。
(本当はPython用のlintを入れたり、Jupyterのプロセスを一度起動したら使いまわしたりした方がテストが早く終わったりで快適かと思われますが、それらは後日機会があれば少しずつ・・)
seleniumでChromeのWebDriverを使う
テスト用のJupyterへのアクセスはseleniumとChromeのWebDriverを使わせていただきました。
過去、PhantomJSやらFireFoxは使ったことがありましたが、今回初のChromeです。前者二つよりも考えるべきことが少なく済んでなんだか快適です。
参考にさせていただきました : Python + Selenium で Chrome の自動操作を一通り
import chromedriver_binaryとするだけでパスが通るのもシンプルでいいですね。
seleniumからJupyterのセルにスクリプトを入力できない問題
テスト時にJupyterやら起動させる点は問題がありませんでしたが、その後selenium経由でJupyterのセル内にスクリプトを入力していこうとしたところ、input周りの構造が大分複雑でうまくいきませんでした。クリックした後にseleniumのsend_keyなどだといまいちうまくいきません。どうやらtextarea関係がJupyter上では実は非表示になっているそうで・・
対策として、開く前にipynbファイルのセルの設定に直接値を設定して、それからノートのページを開くように調整しました。(テスト用であればこれだけでも十分かなと)
ただし、よく調べてみるとselenim経由でDOMを色々操作してしまえばいけそう、という情報が見つかりました。こちらの方がスマートな気がしないでもないので、後日気が向いたら調整しようと思います。
NOTE I have been successful when changing the DOM with javascript execution by making the textarea visible and then sending keys to it. (This was done by removing hidden; from the style attribute in the parent div element that it inherited from. However, I am looking for a solution which does not require altering the DOM.
python Selenium send_keys to a Jupyter notebook
後は、seleniumからRUN ALLメニューなどを操作するスクリプトを書いて、アウトプットの内容を取得してテストするスクリプトを組んでひとまずはテストができそうな気配が出てきました。
アウトプットの要素のスクショがうまく取れない問題
How to take partial screenshot with Selenium WebDriver in python?
テストのためのJupyterやらseleniumなどの準備が整ったので、いざJupyter上でのD3.js経由のアウトプットの表示結果のスクショを取ってみよう・・と上記のstackoverflowの投稿を参考に進めてみたところ、なんだかスクショ領域がずれます。
なぜだろう・・と色々悩んだり調べていたところ、上記のstackoverflow内で以下のコメントを見つけました。
On MacOS (retina) there is problem that web element position in pixels dont match element position in screenshot, due to resize/ratio –
画面の比率の問題・・そういえば、タブレットで作業をしているので、150%(推奨値)に設定していたのを思い出しました。
ちょっと文字が小さい感が無きにしもですが、100%にしてみたところ正常に動作しました・・どうやら、selenium側での座標などの取得値が画面の解像度が100%ではない場合はずれてしまう模様。
てっきりJupyterのヘッダー部分などがある都合、座標がずれるのかとか考えて、非表示にする処理を追加したりしてしまいましたがそうではなかったようで・・。
環境変数的なもので、画面解像度設定のファイルを設置してもいいのですが、少し手間なので一旦100%で進めます。
引数に渡したWebElement要素のスクショを取るコード(基本的にJupyter上のSVG要素を指定):
def save_target_elem_screenshot(
        target_elem, img_path=DEFAULT_TEST_IMG_PATH):
    """
    Save screenshot of target element.

    Parameters
    ----------
    target_elem : selenium.webdriver.remote.webelement.WebElement
        The WebElement for which screen shots are to be taken.
    img_path : str, default DEFAULT_TEST_IMG_PATH
        The destination path.
    """

    driver.find_element_by_tag_name('body').send_keys(
        Keys.CONTROL + Keys.HOME)
    location_dict = target_elem.location
    size_dict = target_elem.size
    elem_x = location_dict['x']
    left = location_dict['x']
    top = location_dict['y']
    right = location_dict['x'] + size_dict['width']
    bottom = location_dict['y'] + size_dict['height']
    screenshot_png = driver.get_screenshot_as_png()
    img = Image.open(BytesIO(screenshot_png))
    img = img.crop((left, top, right, bottom))
    img.save(img_path)
    img.close()
※Jupyterの起動、seleniumの起動、Jupyterの入力のセルにテスト用のスクリプトを設定する処理、テスト用のノートを開く処理、Jupyter上のスクリプトの実行、ヘッダーと入力のセルを非表示にする処理(スクショが途切れないように)、アウトプットのSVG領域のスクショを保存する処理の流れのGIFアニメ:
一部以前使っていたJupyterの拡張機能の都合、通知の許可云々が出てきていますが、害は無いので放置します![]()
スクショの保存結果:

ひとまずはD3.jsを経由しての四角を追加するだけのシンプルなものではありますが、このテストの流れでいけそうな気配があります。
OpenCVでの画像の比較
ヒストグラム比較
参考にさせていただきました。
スクショで取った画像のRGBのヒストグラムを比較して、ほぼ想定した通りの画像になっているのかをチェックするための処理を用意します。(将来、フォントなどの表示が少し変わっても分布の差はそこまで変わらずにテストが通る、といった状況を想定)
OpenCVのcalcHistでヒストグラムの計算、compareHistでヒストグラムの比較をします。
RGBの各チャンネルに対して実施し、それぞれの類似度の平均を取得するようにします。
def compare_img_hist(img_path_1, img_path_2):
    """
    Get the comparison result of the similarity by the histogram of the
    two images. This is suitable for checking whether the image is close
    in color. Conversely, it is not suitable for checking whether shapes
    are similar.

    Parameters
    ----------
    img_path_1 : str
        The path of the first image for comparison.
    img_path_2 : str
        The path of the second image for comparison.

    Returns
    -------
    similarity : float
        Similarity between two images. The maximum is set to 1.0, and the
        closer to 1.0, the higher the similarity. It is set by the mean
        value of the histogram of RGB channels.
    """
    assert_img_exists(img_path=img_path_1)
    assert_img_exists(img_path=img_path_2)
    img_1 = cv2.imread(img_path_1)
    img_2 = cv2.imread(img_path_2)
    channels_list = [[0], [1], [2]]
    similarity_list = []

    for channels in channels_list:
        img_1_hist = cv2.calcHist(
            images=[img_1],
            channels=channels,
            mask=None,
            histSize=[256],
            ranges=[0, 256]
        )
        img_2_hist = cv2.calcHist(
            images=[img_2],
            channels=channels,
            mask=None,
            histSize=[256],
            ranges=[0, 256]
        )
        similarity_unit = cv2.compareHist(
            H1=img_1_hist, H2=img_2_hist, method=cv2.HISTCMP_CORREL)
        similarity_list.append(similarity_unit)
    similarity = np.mean(similarity_list)
    return similarity
試しにテストで真っ赤な画像2枚を指定して、類似度が1.0(最大)になっていることや、赤と緑の画像を比較して類似度が下がっていることを確認しました。
※注 赤と緑の画像の比較でも、青は両方とも0でそこは類似しているという判定になるので、類似度が0にはならない点に注意します。
from nose.tools import assert_equal, assert_true, assert_raises, \
    assert_less_equal
from PIL import Image

...

    img = Image.new(mode='RGB', size=(50, 50), color='#ff0000')
    img.save(TEST_IMG_PATH_1)
    img.save(TEST_IMG_PATH_2)
    img.close()
    similarity = img_helper.compare_img_hist(
        img_path_1=TEST_IMG_PATH_1,
        img_path_2=TEST_IMG_PATH_2)
    assert_equal(similarity, 1.0)

    img = Image.new(mode='RGB', size=(50, 50), color='#00ff00')
    img.save(TEST_IMG_PATH_2)
    img.close()
    similarity = img_helper.compare_img_hist(
        img_path_1=TEST_IMG_PATH_1,
        img_path_2=TEST_IMG_PATH_2)
    assert_less_equal(similarity, 0.5)
テストでのしきい値はそのうち様子を見て調整していくとして、これでとりあえずはエラーなんかで画像が表示されていない!とかデグレして全然違うように表示されてしまっている!といったことがチェックできます。
色ではなく形を重視して比較する方法(例えば、カラーセットの変更を加味して実装した場合のテストなど)もありますが、そちらは必要性を感じてきたら追加するようにします。
実際にプロットの機能の実装を考える
ここまでが結構長かった感じですが、やっと本格的なプロットの機能を考えていきます。
最初にどういったものを作るか・・という点ですが、シンプルなプロットであればPythonで様々な選択肢があり、それを作るのでは面白みがありません。そのため、まだ他の方で作られてなさそうな、Storytelling with Data: A Data Visualization Guide for Business Professionalsの書籍に出てくるようなプロットのPythonでの実装を考えてみます。
どういったプロットかというと、「極力シンプルに」「何を伝えたいのかを極力明確に」「なるべく短時間で使えたい内容を伝える」「より効果的にするためにデザインの知見を活かす」「色弱の方でも伝わる配色」といったような、スパゲッティコードならぬスパゲッティグラフを回避するためのプロットです。
プレゼンで聞いている方への説明で短時間で伝えないといけない際など、ビジネスで役立ちます。
詳細は著者の方のサイトのhow I storyboardなどもご確認ください。
まずは一つのラインのみ目立たせる折れ線グラフから
ベーシックなものを作っていきます。
伝えたい内容が一つの数値だけで、他の要素はあまり重要ではないようなケースで使うようなプロットを考えます。
折れ線グラフで、目立たせるものを青色、他をグレーの配色にします。(色弱の方でも区別が付きやすく、青の部分があなたが伝えたいことということが瞬時に分かるプロット)
その他、以下のような点を対応します。
- 凡例を端の方でまとめる形ではなく、折れ線グラフの右端に配置するのを想定します。
- タイトル・説明文をオプションとして設定できるようにします。
- X軸の値は日付(時系列のデータ)を想定します。
- 年の表記は毎回設定する必要がないのと、X軸の表示を回転させると可読性が下がるそうなので、回転させずに年と月日で2段の表示とします。
- Y軸のラベルをオプションで設定できるようにします。(何の値なのかのラベル)
- Y軸のラベルで、前後に文字列をオプションで設定できるようにします。(例 : $や円や%記号など)
Storytelling with data for grants managersの記事に、良くない例(Before)と修正後の良い例(After)が載っています。
モックを作る
最初からJupyterへの組み込みをしながらレイアウトなどの調整をするのはしんどいため、最初はHTML単体で書いてみます。こうすることで、色々D3.jsで試行錯誤がしやすかったり、最終的にPython側から渡さないといけないパラメーターの洗い出しなどを目的とします。
こんな感じになりました。

<!DOCTYPE html>
<html>
    <head>
        <meta charset="utf-8">
        <script src="https://d3js.org/d3.v4.js"></script>
        <style>
            #test-svg {
                border: 1px solid #999999;
            }

            #test-svg .font {
                font-family: -apple-system, BlinkMacSystemFont, "Helvetica Neue", YuGothic, "ヒラギノ角ゴ ProN W3", Hiragino Kaku Gothic ProN, Arial, "メイリオ", Meiryo, sans-serif;
            }

            #test-svg .title {
                fill: #6bb2f8;
                font-size: 25px;
            }

            #test-svg .description {
                font-size: 14px;
                fill: #999999;
            }

            #test-svg .legend {
                font-size: 14px;
                fill: #999999;
            }

            #test-svg .stands-out-legend {
                font-size: 14px;
                fill: #6bb2f8;
                font-weight: bold;
            }

            #test-svg .x-axis path,
            #test-svg .y-axis path,
            #test-svg .x-axis line,
            #test-svg .y-axis line {
                stroke: #999999;
                shape-rendering: crispEdges;
            }

            #test-svg .x-axis text,
            #test-svg .x-axis-year,
            #test-svg .y-axis text,
            #test-svg .y-axis-label {
                font-family: -apple-system, BlinkMacSystemFont, "Helvetica Neue", YuGothic, "ヒラギノ角ゴ ProN W3", Hiragino Kaku Gothic ProN, Arial, "メイリオ", Meiryo, sans-serif;
                fill: #999999;
                font-size: 14px;
            }

            #test-svg .line {
                fill: none;
                stroke: #cccccc;
                stroke-width: 2.5;
            }

            #test-svg .stands-out-line {
                fill: none;
                stroke: #acd5ff;
                stroke-width: 4.0;
            }
        </style>
    </head>
    <body>

        <script>

            const SVG_ID = "test-svg";
            const SVG_WIDTH = 600;
            const SVG_HEIGHT = 372;
            const OUTER_MARGIN = 20;
            const X_TICKS = 5;
            const Y_TICKS = 5;
            const Y_AXIS_PREFIX = "";
            const Y_AXIS_SUFFIX = "";
            const PLOT_TITLE_TXT = "Time series of fruit prices.";
            const PLOT_DESCRIPTION_TXT = "Orange price keeps stable value in the long term.";

            const DATASET = [{
                date: new Date(2018, 0, 1),
                Apple: 100,
                Orange: 120,
                Melon: 250
            }, {
                date: new Date(2018, 3, 12),
                Apple: 120,
                Orange: 150,
                Melon: 220
            }, {
                date: new Date(2018, 10, 3),
                Apple: 110,
                Orange: 100,
                Melon: 330
            }, {
                date: new Date(2019, 1, 10),
                Apple: 130,
                Orange: 160,
                Melon: 310
            }]
            const COLUMN_LIST = ["Apple", "Melon"];
            const STANDS_OUT_COLUMN_LIST = ["Orange"];
            var MERGED_COLUMN_LIST = COLUMN_LIST.concat(STANDS_OUT_COLUMN_LIST);
            const LEGEND_DATASET = [
                {key: "Apple", value: 130},
                {key: "Orange", value: 160},
                {key: "Melon", value: 310}
            ];
            const LEGEND_KEY = function(d) {
                return d.key;
            }
            const YEAR_DATASET = [
                new Date(2018, 0, 1),
                new Date(2019, 0, 1)
            ];
            const Y_AXIS_MIN = 0;
            const Y_AXIS_MAX = 310 * 1.1;
            const Y_AXIS_LABEL = "Price of each fruit";
            const X_AXIS_MIN = new Date(2018, 0, 1);
            const X_AXIS_MAX = new Date(2019, 1, 10);

            var svg = d3.select("body")
                .append("svg")
                .attr("width", SVG_WIDTH)
                .attr("height", SVG_HEIGHT)
                .attr("id", SVG_ID)

            var plotBaseLineY = 0;
            if (PLOT_TITLE_TXT !== "") {
                var plotTitle = svg.append("text")
                    .attr("x", OUTER_MARGIN)
                    .attr("y", OUTER_MARGIN)
                    .attr("dominant-baseline", "hanging")
                    .text(PLOT_TITLE_TXT)
                    .classed("title font", true);
                var plotTitleBBox = plotTitle.node().getBBox();
                plotBaseLineY += plotTitleBBox.y + plotTitleBBox.height;
            }

            if (PLOT_DESCRIPTION_TXT !== "") {
                var plotDescription = svg.append("text")
                    .attr("x", OUTER_MARGIN)
                    .attr("y", plotBaseLineY + 10)
                    .attr("dominant-baseline", "hanging")
                    .text(PLOT_DESCRIPTION_TXT)
                    .classed("description font", true);
                var plotDesciptionBBox = plotDescription.node().getBBox();
                plotBaseLineY += plotDesciptionBBox.height + 10;
            }

            var legend = svg.selectAll("legend")
                .data(LEGEND_DATASET, LEGEND_KEY)
                .enter()
                .append("text")
                .text(function(d) {
                    return d.key;
                })
                .attr("dominant-baseline", "central");
            legend.each(function(d) {
                var className;
                if (STANDS_OUT_COLUMN_LIST.indexOf(d.key) >= 0) {
                    className = "legend stands-out-legend font";
                }else {
                    className = "legend font";
                }
                d3.select(this)
                    .classed(className, true);
            })

            var yLabelMarginAdjust = 0;
            if (Y_AXIS_LABEL !== "") {
                var yAxisLabel = svg.append("text")
                    .text(Y_AXIS_LABEL)
                    .attr("transform", "rotate(270)")
                    .attr("text-anchor", "end")
                    .attr("dominant-baseline", "text-before-edge")
                    .classed("font y-axis-label", true);
                yAxisLabel.attr("x", -plotBaseLineY - OUTER_MARGIN + 1)
                    .attr("y", OUTER_MARGIN - 3);
                var yAxisLabelBBox = yAxisLabel.node()
                    .getBBox();
                yLabelMarginAdjust = yAxisLabelBBox.height + 2;
            }
            var yAxisScale = d3.scaleLinear()
                .domain([Y_AXIS_MIN, Y_AXIS_MAX])
                .range([SVG_HEIGHT - OUTER_MARGIN, plotBaseLineY + OUTER_MARGIN]);
            var yAxis = d3.axisLeft()
                .scale(yAxisScale)
                .ticks(Y_TICKS)
                .tickFormat(function (d) {
                    var tickFormat = d;
                    if (Y_AXIS_PREFIX !== "") {
                        tickFormat = Y_AXIS_PREFIX + tickFormat;
                    }
                    if (Y_AXIS_SUFFIX !== "") {
                        tickFormat += Y_AXIS_SUFFIX;
                    }
                    return tickFormat;
                });
            var yAxisGroup = svg.append("g")
                .classed("y-axis font", true)
                .call(yAxis);
            var yAxisBBox = yAxisGroup
                .node()
                .getBBox();
            var yAxisPositionX = OUTER_MARGIN + yAxisBBox.width + yLabelMarginAdjust;
            yAxisGroup.attr("transform", "translate(" + yAxisPositionX + ", 0)");

            var xAxisScale = d3.scaleTime()
                .domain([X_AXIS_MIN, X_AXIS_MAX])
                .range([yAxisPositionX, SVG_WIDTH - OUTER_MARGIN]);

            var yearFormat = d3.timeFormat("%Y");
            var year = svg.selectAll("year")
                .data(YEAR_DATASET)
                .enter()
                .append("text")
                .text(function(d) {
                    return yearFormat(d);
                })
                .attr("text-anchor", "middle")
                .attr("x", function(d) {
                    return xAxisScale(d);
                })
                .attr("y", SVG_HEIGHT - OUTER_MARGIN)
                .classed("font x-axis-year", true);
            var yearBBox = year.node()
                .getBBox()

            var xAxis = d3.axisBottom()
                .scale(xAxisScale)
                .ticks(X_TICKS)
                .tickFormat(d3.timeFormat("%m/%d"));
            var xAxisGroup = svg.append("g")
                .classed("x-axis font", true)
                .call(xAxis)
            var xAxisBBox = xAxisGroup
                .node()
                .getBBox();
            xAxisPositionY = SVG_HEIGHT - OUTER_MARGIN - xAxisBBox.height - yearBBox.height;
            xAxisGroup.attr(
                "transform",
                "translate(0, " + xAxisPositionY + ")");

            yAxisScale.range([xAxisPositionY, plotBaseLineY + OUTER_MARGIN]);
            yAxis.scale(yAxisScale);
            yAxisGroup.call(yAxis);

            var legendMaxWidth = 0;
            svg.selectAll(".legend").each(function(d) {
                var width = d3.select(this)
                    .node()
                    .getBBox()["width"];
                legendMaxWidth = Math.max(legendMaxWidth, width);
            });
            svg.selectAll(".legend")
                .attr("x", function(d) {
                    return SVG_WIDTH - OUTER_MARGIN - legendMaxWidth;
                })
                .attr("y", function(d) {
                    return yAxisScale(d.value);
                });
            xAxisScale.range(
                [yAxisPositionX, SVG_WIDTH - OUTER_MARGIN - legendMaxWidth - 10]);
            xAxis.scale(xAxisScale);
            xAxisGroup.call(xAxis);
            year.attr("x", function(d) {
                return xAxisScale(d);
            });

            for (var i = 0; i < MERGED_COLUMN_LIST.length; i++) {
                var columnName = MERGED_COLUMN_LIST[i];
                var line = d3.line()
                    .x(function (d) {
                        return xAxisScale(d.date);
                    })
                    .y(function (d) {
                        return yAxisScale(d[columnName]);
                    });
                var line_class;
                if (STANDS_OUT_COLUMN_LIST.indexOf(columnName) >= 0) {
                    className = "stands-out-line";
                }else {
                    className = "line";
                }
                svg.append("path")
                    .datum(DATASET)
                    .classed(className, true)
                    .attr("d", line);
            }
        </script>
    </body>
</html>
若干、複数回scaleを調整しているところとかはもうちょっとシンプルにできそうな気配かありますが、D3.jsのコードをもっとたくさん書いていれば段々洗練されていくのでしょう・・。
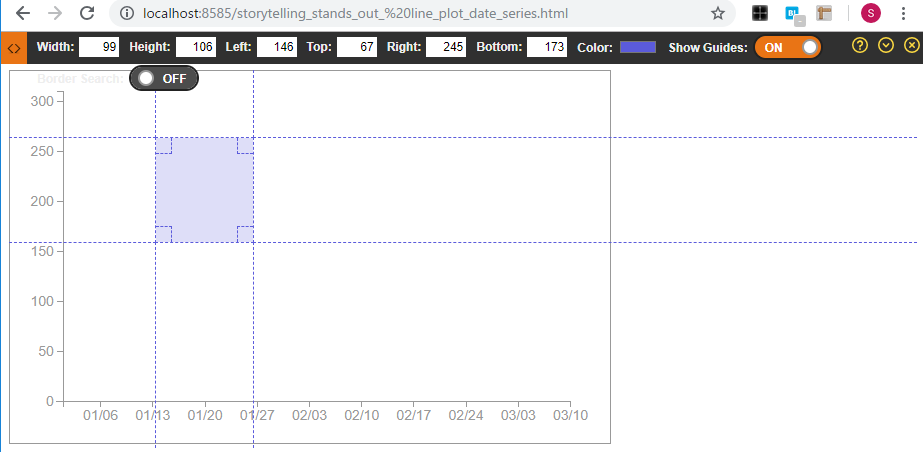
作業中、結構アンカーポイントやバウンディングボックス関係の設定で、合っているのか結構不安だったため、Chrome拡張のRuler関係のツールを多用していました。
また、色弱の方に対する表示も確認しておきます(水色と灰色の組み合わせは大丈夫だよ、と書籍に書かれていたものの一応)。
Chromatic Vision Simulatorというツールを利用させていただきました。
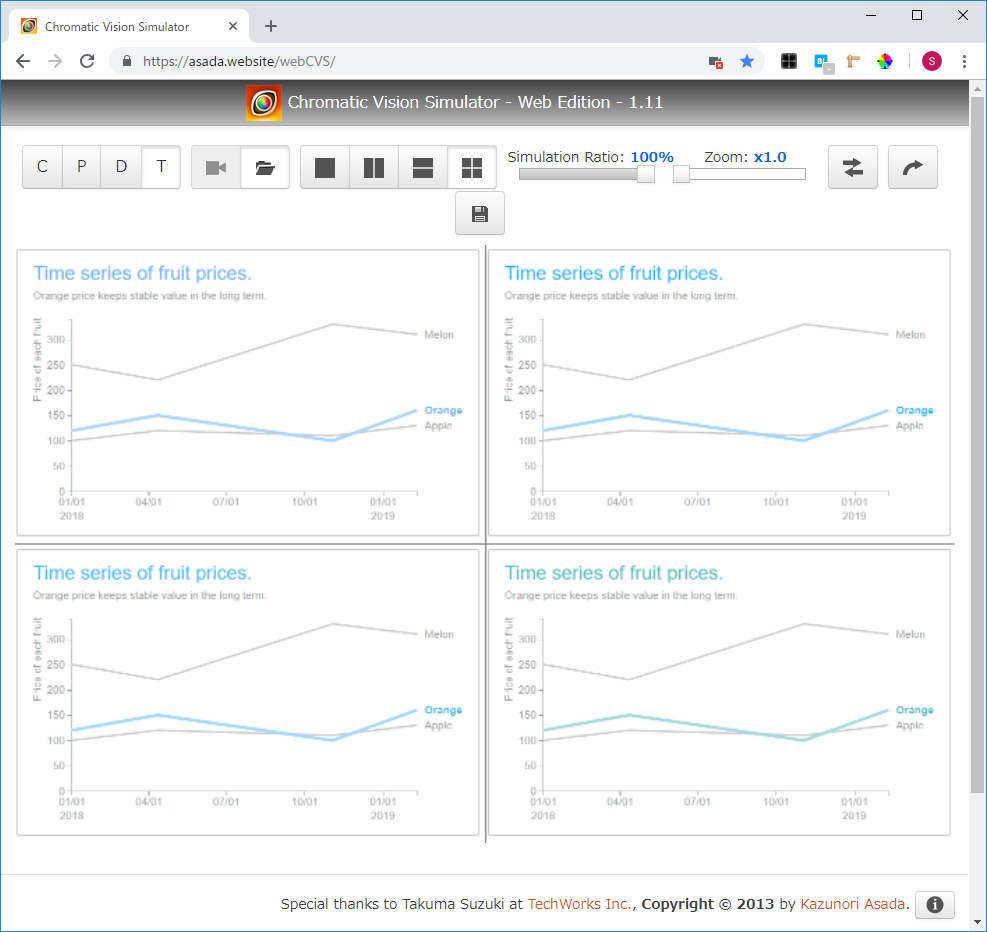
ちゃんと目立たせている場所とそうではない場所の区別が付くようで、大丈夫そうですね。
組み込んでJupyter上で表示できるようにする
作ったモックを組み込んでいきます。テンプレートとしてのjsとCSSのファイルを用意してそれらを文字列としてPythonで読み込み、パラメーターを置換して、最後にIPython.displayモジュール内のdisplay関数でJupyter上で表示します。
jsのテンプレートでは、以下のようにPythonの文字列のformat関数やDjangoのテンプレートのPython変数に近い感覚で、{変数名}のという形で記述しました。
...
const SVG_WIDTH = {svg_width};
const SVG_HEIGHT = {svg_height};
const SVG_BACKGROUND_COLOR = "{svg_background_color}";
const SVG_MARGIN_LEFT = {svg_margin_left};
const OUTER_MARGIN = {outer_margin};
...
CSS側は、{}の括弧で書いてしまうとVS Code上でエラーになり、入力補完が効かなくなって辛い感じなので、--変数名--という形式で置換対象のパラメーターを設定しました。
...

    fill: --axis_text_color--;
    font-size: --axis_font_size--px;
...
テンプレートのjsとCSS読み込み処理は以下のように対応してみました。
def read_template_str(template_file_path):
    """
    Read string of template file.

    Parameters
    ----------
    template_file_path : str
        The path of the template file under the template directory.
        e.g., storytelling/simple_line_date_series_plot.css

    Returns
    -------
    template_str
        Loaded template string. The repr function is set.

    Raises
    ------
    Exception
        If the file can not be found.
    """
    file_path = os.path.join(
        settings.ROOT_DIR, 'plot_playground', 'template',
        template_file_path)
    if not os.path.exists(file_path):
        err_msg = 'Template file not found : %s' % file_path
        raise Exception(err_msg)
    with open(file_path, 'r') as f:
        template_str = f.read()
    template_str = re.sub(re.compile('/\*.*?\*/', re.DOTALL) , '', template_str)
    template_str = repr(template_str)[1:-1]
    template_str = template_str.replace('\\n', '\n')
    return template_str
ここで注意が必要な点として、Pythonの通常の文字列は{}の括弧や%などの記号が意味を持ちます。(%sなどと文字列内で記述したりなど)
{}内の記述がうまく表示されない一方で、jsなどだとこの括弧の記号が多用されます。
そのため、Python上で生の文字列として扱う必要があります。
Python上で定義する文字列であれば以下のようにクォーテーションの前にrを付けることで生(raw)の文字列として扱われます。
sample_str = r'{your_variable}'
一方で、今回はテンプレートのファイルを読み込んで生の文字列にする必要があります。
そういった場合にはrepr関数を使います。ただ、r記号を付けた場合と若干挙動が異なり、最初と最後に余分なクォーテーションが付与されてしまうのと、改行までエスケープされます。そのため、以下の記述で最初と最後の文字を取り除き、且つ改行を普通に改行させるために置換をしています。
    template_str = repr(template_str)[1:-1]
    template_str = template_str.replace('\\n', '\n')
その他、正規表現でテンプレートの上部などに設けていたコメント部分を取り除いています。
template_str = re.sub(re.compile('/\*.*?\*/', re.DOTALL) , '', template_str)
置換処理として以下のような関数を用意しました。
辞書のキーにテンプレート上のパラメーター名、値に置換するPythonのパラメーターを設定して、ループで回して置換しています。
def apply_css_param_to_template(css_template_str, css_param):
    """
    Apply the parameters to the CSS template.

    Parameters
    ----------
    css_template_str : str
        String of CSS template.
    css_param : dict
        A dictionary that stores parameter name in key and parameter
        in value. Parameter name corresponds to string excluding hyphens
        in template.

    Returns
    -------
    css_template_str : str
        Template string after parameters are reflected.
    """
    for key, value in css_param.items():
        key = '--%s--' % key
        css_template_str = css_template_str.replace(key, str(value))
    return css_template_str


def apply_js_param_to_template(js_template_str, js_param):
    """
    Apply the parameters to the js template.

    Parameters
    ----------
    js_template_str : str
        String of js template.
    js_param : dict
        A dictionary that stores parameter name in key and parameter
        in value. If the parameter is a list or dictionary, it is
        converted to Json format.

    Returns
    -------
    js_template_str : str
        Template string after parameters are reflected.
    """
    for key, value in js_param.items():
        if isinstance(value, (dict, list)):
            value = data_helper.convert_dict_or_list_numpy_val_to_python_val(
                target_obj=value)
            value = json.dumps(value)
        key = r'{' + key + r'}'
        value = str(value)
        js_template_str = js_template_str.replace(key, value)
    return js_template_str
一部、配列や辞書などもパラメーターで渡しているのですが、Pandasなどを経由している都合、NumPyの型の数値など(np.int64など)が紛れ込んでいるとjsonモジュールでJSON形式に変換できないので、NumPyの型の数値部分を置換する処理を挟みました。
def convert_numpy_val_to_python_val(value):
    """
    Convert NumPy type value to Python type value.

    Parameters
    ----------
    value : *
        The value to be converted.

    Returns
    -------
    value : *
        The converted value.
    """
    np_int_types = (
        np.int,
        np.int8,
        np.int16,
        np.int32,
        np.int64,
        np.uint,
        np.uint8,
        np.uint16,
        np.uint32,
        np.uint64,
    )
    if isinstance(value, np_int_types):
        return int(value)
    np_float_types = (
        np.float,
        np.float16,
        np.float32,
        np.float64,
    )
    if isinstance(value, np_float_types):
        return float(value)
    return value


def convert_dict_or_list_numpy_val_to_python_val(target_obj):
    """
    Converts the value of NumPy type in dictionary or list into
    Python type value.

    Parameters
    ----------
    target_obj : dict or list
        Dictionary or list to be converted.

    Returns
    -------
    target_obj : dict or list
        Dictionary or list after conversion.

    Raises
    ------
    ValueError
        If dictionaries and lists are specified.
    """
    if isinstance(target_obj, dict):
        for key, value in target_obj.items():
            if isinstance(value, (dict, list)):
                target_obj[key] = convert_dict_or_list_numpy_val_to_python_val(
                    target_obj=value
                )
                continue
            target_obj[key] = convert_numpy_val_to_python_val(
                value=value)
            continue
        return target_obj
    if isinstance(target_obj, list):
        for i, value in enumerate(target_obj):
            if isinstance(value, (dict, list)):
                target_obj[i] = convert_dict_or_list_numpy_val_to_python_val(
                    target_obj=value
                )
                continue
            target_obj[i] = convert_numpy_val_to_python_val(value=value)
            continue
        return target_obj
    err_msg = 'A type that is not a dictionary or list is specified: %s' \
        % type(target_obj)
    raise ValueError(err_msg)
※若干、NumPy側で探せば関数が用意されている気配がしないでもないです・・。
表示してみる
実際にJupyter上で確認してみます。すごい適当なデータフレームを用意しました。
import pandas as pd
from plot_playground.storytelling import simple_line_date_series_plot

df = pd.DataFrame(data=[{
    'date': '2017-11-03',
    'apple': 100,
    'orange': 140,
}, {
    'date': '2017-12-03',
    'apple': 90,
    'orange': 85,
}, {
    'date': '2018-04-03',
    'apple': 120,
    'orange': 170,
}, {
    'date': '2018-09-03',
    'apple': 110,
    'orange': 180,
}, {
    'date': '2019-02-01',
    'apple': 90,
    'orange': 150,
}])
以下の関数内で、テンプレートの読み込みやら置換やらdisplay関数の呼び出しなどをしています。
simple_line_date_series_plot.display_plot(
    df=df,
    date_column='date',
    normal_columns=['apple'],
    stands_out_columns=['orange'],
    title='Time series of fruit prices.',
    description='Orange price keeps stable value in the long term.')

無事Jupyter上で表示できました!大体完成ですが、scikit-learnなどみたくメタデータ的なものを返却したり、このプロットのテストを追加したり細かいところを対応しておきます。
PyPI登録
pipでインストールできるように、PyPI登録を進めます。
他の方が色々記事を書かれているのでここでは基本的なところは触れずに、躓いたところを中心に触れておきます。
1. 同じバージョンのものは削除してももうアップできない
当たり前かもしれませんが、一度テストでTestのPyPI環境(ステージング的な環境)にアップして、後日web画面からそのバージョンを消して再度アップしようとしたら弾かれました。テスト環境でも、バージョンの番号を上げるしかなさそう?な印象です。(特に困ったりはしませんが・・)
2. ビルドの前に、過去のビルドで生成されたディレクトリを削除しておいた方が良さそう
前のものが含まれているとアップのときに弾かれたり、事故の元になりそうです。
この辺りのビルドのスクリプトは大した量ではないので後で書いておきたいところ・・。
3. cssやjsをパッケージ内に含んでくれなかった
最初、.pyのモジュールしかビルド内に含んでくれませんでした。
調べたところ、setup.pyなどのビルド用のモジュールと同じフォルダにMANIFEST.inというファイルを設置して、含めるファイルを指定しないといけなかった模様です。
今回は以下のようにjsとCSSを含むように指定しました。
recursive-include plot_playground *.js
recursive-include plot_playground *.css
さらに、MANIFEST.inに書いただけでは含んでくれず、setup.pyのsetup関数内で以下の記述をしないと含![]() んでくれませんでした。他の記事でMANIFEST.inだけ触れられていたものを参考にしていたのでしばらく悩むことに・・
んでくれませんでした。他の記事でMANIFEST.inだけ触れられていたものを参考にしていたのでしばらく悩むことに・・
include_package_data=True,
以下の記事に上記の点が書かれていました。助かりました![]()
Pythonのパッケージングのベストプラクティスについて考える2018
ここまでできたら、ステージング環境的なTestのPyPIにアップして動かしてみます。
Windows環境で作業していたので、ついでにLinuxでも念のため確認・・ということで、Azure Notebooksのクラウドのノートを利用しました。
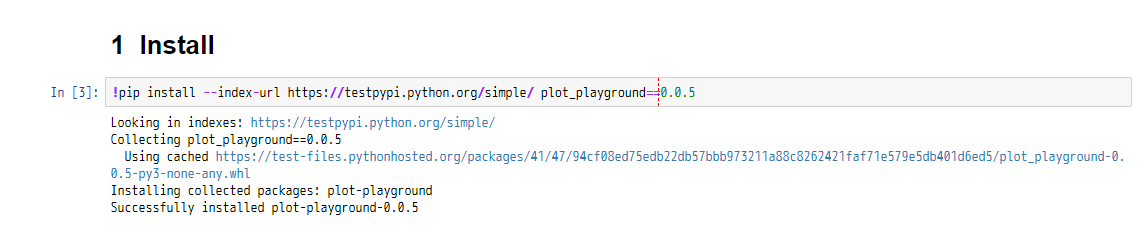
ちょっと普通のpipコマンドと比べると、テスト環境なのでURLを指定したりで少し長いですが、無事インストールできました!

jsやCSSのテンプレートファイルも、問題なく読み込めているようです。
後は本番のPyPI環境にアップするだけですので、本番にアップします。
この段階で、お馴染みのpipコマンドでインストールできるようになります。
再び、Azure Notebooks上で試してみます。
既にテスト用のものがインストールされているので一旦アンインストールしてから実施します(ノートのカーネルも再起動しつつ)。

無事インストールできました。
長かったですがこれでやっと完了です!ちょっとドキュメントを書いたりは明日以降進めます。
また、まだプロットが1つだけで寂しいので、少しずつ作っていきたいところです。今回はテスト用のコードを書いたり、D3.jsとJupyterを繋いだり・・のところなども対応や検証が必要だったので、結構時間がかかりましたが、次回からは本質的なプロットの追加作業に注力できる・・はず。
おまけ
※まだドキュメントなど全然書いていません。