今までは、C/C++のブレークポイントデバッグは、vimでgdbを扱っていたのですが、VSCodeのRemote Developmentのgdbの操作が思ったより直観的で簡単だったので紹介。

特に競技プログラミングをされる方で変数の中身を見たり、いじったりしながらデバッグしたい方には向くかなと思います。
まず、N予備校などのLinux環境構築(N予備校にログインが必要)に準拠しながらVagrant+VirtualBoxでUbuntu18.04の環境を構築。
Ubuntuのコンソール内でC/C++開発デバッグに関するツールを一通りインストールしておく。
sudo apt install g++
sudo apt install build-essential
sudo apt install gdb
VSCodeでRemote Development拡張をインストール。

インストール後、左下の緑色のボタンを押して、
Remote-SSH: Open Configuration File... から C:\Users\username\.ssh\configを選択し
# Read more about SSH config files: https://linux.die.net/man/5/ssh_config
Host ubuntu64_18
  HostName     127.0.0.1
  Port         2222
  User         vagrant
  IdentityFile C:\Users\username\vagrant\ubuntu64_18\.vagrant\machines\default\virtualbox\private_key
のように記述。 username は自分のユーザー名に変更のこと。保存して、緑のボタンから
Remote-SSH: Connect to Host より、 ubuntu64_18 を選択し、 Open Folder よりC++ファイルがあるフォルダを開く。C++ファイルを開くとC++の拡張のインストールを勧められるのでインストール。
あとはデバッグタグからRUNボタンを選ぶと、tasks.json と launch.json の設定を求められるので、テンプレートに合わせて、 g++ アクティブファイルのビルドとデバッグ を設定する。といってもテンプレートのまま変更するところはなし。
tasks.json:
{
    // See https://go.microsoft.com/fwlink/?LinkId=733558
    // for the documentation about the tasks.json format
    "version": "2.0.0",
    "tasks": [
        {
            "type": "shell",
            "label": "g++ build active file",
            "command": "/usr/bin/g++",
            "args": [
                "-g",
                "${file}",
                "-o",
                "${fileDirname}/${fileBasenameNoExtension}"
            ],
            "options": {
                "cwd": "/usr/bin"
            },
            "problemMatcher": [
                "$gcc"
            ],
            "group": "build"
        }
    ]
}
launch.json:
{
    // Use IntelliSense to learn about possible attributes.
    // Hover to view descriptions of existing attributes.
    // For more information, visit: https://go.microsoft.com/fwlink/?linkid=830387
    "version": "0.2.0",
    "configurations": [
        {
            "name": "g++ - アクティブ ファイルのビルドとデバッグ",
            "type": "cppdbg",
            "request": "launch",
            "program": "${fileDirname}/${fileBasenameNoExtension}",
            "args": [],
            "stopAtEntry": false,
            "cwd": "${workspaceFolder}",
            "environment": [],
            "externalConsole": false,
            "MIMode": "gdb",
            "setupCommands": [
                {
                    "description": "gdb の再フォーマットを有効にする",
                    "text": "-enable-pretty-printing",
                    "ignoreFailures": true
                }
            ],
            "preLaunchTask": "g++ build active file",
            "miDebuggerPath": "/usr/bin/gdb"
        }
    ]
}
あとはデバッグタブのRunボタンを押すだけ、これでブレークポイントが発動して実行ポイントを進めたりできる。ブレークポイントはC++ファイルの行表示の左側をクリックすると追加できる。
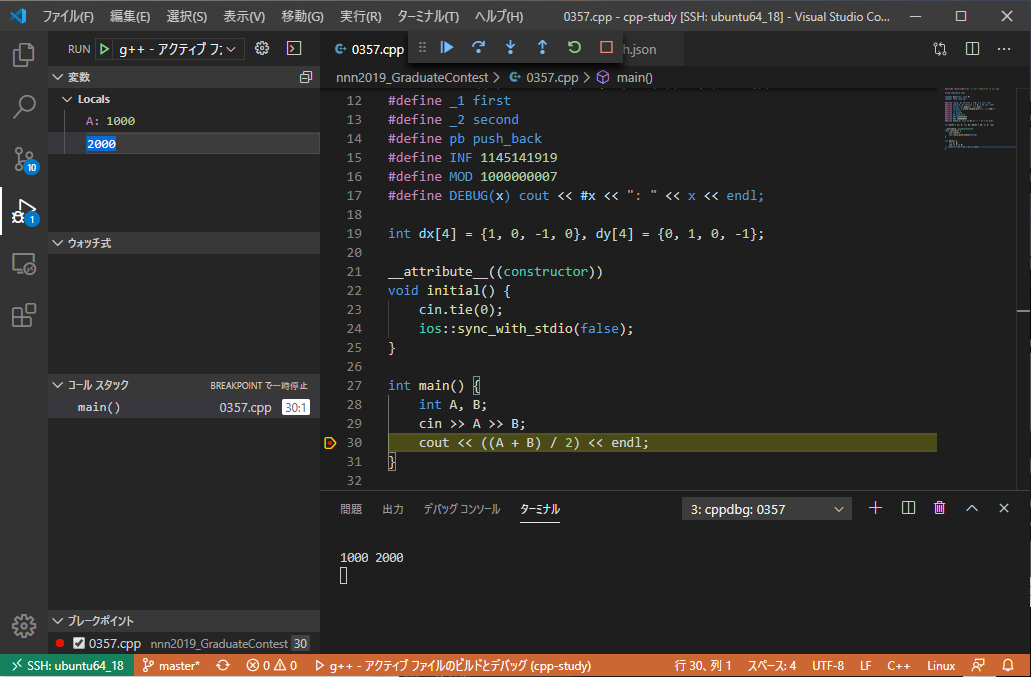
もちろん、右下のターミナルのところから、標準入力をしたり、標準出力を見たりもできるので競技プログラミングなどもやりやすい。ちなみに変数エリアでは、変数の中身も書き換えることが可能なので迅速なデバッグもできる。あと、地味にF5キーを押すとビルドとデバッグ実行まで一気にやってくれるのでそれが便利です。
VSCode のRemote Developmentを使ったgdbデバッグがとても簡単で分かりやすいという紹介でした。
以上。