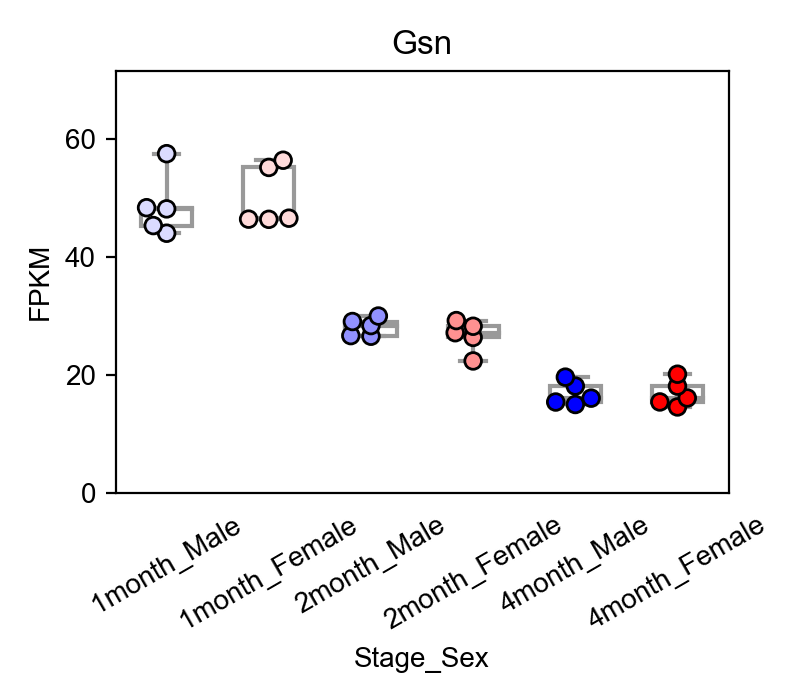
本稿では下の図のような「Swarmplot」をPythonを用いて作成する方法を解説する。

Swarmplotとは
エクセルを用いたグラフの作成は最も手軽な手法のひとつであるが、棒グラフ + ドットプロットを作成しようとして、このような図になった経験はないだろうか?

このような図でも悪くはないのだが、ドットプロットの点同士が重なってしまっており、サンプル数および値の分布を把握しにくい。対して本稿の最初に示したSwarmplotであるが、Swarmとは群れ、特に蜂の群を意味する英単語であり、ドットプロットの点同士がお互いを避けるように配置される。Swarmplotの利点は、サンプル数を確認しやすい、値の分布を把握しやすい、(かっこいい) という点が挙げられる。本稿ではPythonを用いてこちらのSwarmplotを作成する方法を解説する。
使用データ
本稿では、先行研究の公開データを用いてデモ解析を行う。
生後1ヶ月、2ヶ月、4ヶ月齢の雌雄両方のマウス由来の海馬を用いたRNA-Seq解析データを利用する (Bundy et al. BMC Genet. 2017, #GSE83931)。
| Age | Sex | Sample Number |
|---|---|---|
| 1 month | Male | 5 |
| 1 month | Female | 5 |
| 2 month | Male | 5 |
| 2 month | Female | 5 |
| 4 month | Male | 5 |
| 4 month | Male | 5 |
上記公開データのXlsxファイル(GSE83931_Counts_and_FPKM.xlsx)の中の「FPKM」シートのデータの一部を解析に使用した。
データ準備
Swarm plotを作成するため、Pythonのseabornライブラリのswarmplotを使用する (https://seaborn.pydata.org/generated/seaborn.swarmplot.html 2022年6月11日アクセス)。
インプットデータとして DataFrame, array, list of arrays が利用可能であるが、本稿ではDataFrameをインプットとして使用するためのデータ準備を行う。「データの種類を示すカラム」と「データが入っているカラム」の二つがあればよい。
本稿では先述のデータのうち、"Gsn"という遺伝子の発現量を抜き出した、下記のデータを使用する。
| Stage_Sex | FPKM |
|---|---|
| 1Month_Male | 45.2631 |
| 1Month_Male | 57.4333 |
| 1Month_Male | 48.2849 |
| 1Month_Male | 48.0871 |
| 1Month_Male | 43.9621 |
| 1Month_Female | 55.1056 |
| 1Month_Female | 46.5095 |
| 1Month_Female | 56.3264 |
| 1Month_Female | 46.3202 |
| 1Month_Female | 46.3484 |
| 2Month_Male | 29.9399 |
| 2Month_Male | 26.5188 |
| 2Month_Male | 29.0108 |
| 2Month_Male | 26.6254 |
| 2Month_Male | 28.3245 |
| 2Month_Female | 26.3186 |
| 2Month_Female | 28.21 |
| 2Month_Female | 29.1694 |
| 2Month_Female | 27.115 |
| 2Month_Female | 22.3331 |
| 4Month_Male | 18.0798 |
| 4Month_Male | 16.033 |
| 4Month_Male | 14.9581 |
| 4Month_Male | 15.3771 |
| 4Month_Male | 19.5911 |
| 4Month_Female | 20.0864 |
| 4Month_Female | 15.3894 |
| 4Month_Female | 16.0616 |
| 4Month_Female | 14.544 |
| 4Month_Female | 18.0652 |
Pythonでの実装
file_path: 上記のデータのパス
import pandas as pd
import numpy as np
import matplotlib.pyplot as plt
import seaborn as sns

FPKM_data = pd.read_excel(file_path, header=0, index_col=None)

# グラフ作成用の準備
red1 = [1.0, 0.57, 0.57]; red2 = [1.0, 0.86, 0.86]
blue1 = [0.57, 0.57, 1.0]; blue2 = [0.86, 0.86, 1.0]
orig_pal=[blue2, red2, blue1, red1, 'blue', 'red']

fig, ax1 = plt.subplots(figsize=(4,3.5), dpi=100) #Figureのサイズと解像度
# 下のSwarmplotのパラメータの中で、x= に生物学的グループが記入されているデータの列名を入れる。
# y= に実数値が入っているデータの列名を入れる。
sns.swarmplot(ax=ax1, x='Stage_Sex', y='FPKM', data=FPKM_data, palette=orig_pal, size=6, edgecolor='black', linewidth=1)
sns.boxplot(ax=ax1, x='Stage_Sex', y='FPKM', data=FPKM_data, color='white', whis=np.inf, width=0.5)
ax1.tick_params(top=False, right=False, left=True, bottom=False)
ax1.tick_params(axis='x', labelsize=8)
ax1.tick_params(axis='x', labelrotation=30)
y_min, y_max = ax1.get_ylim()
ax1.set_ylim(0, y_max*1.2)
ax1.set_title('Gsn')
plt.xticks(fontsize=10)
plt.tight_layout()
plt.rcParams['font.family'] = 'Arial'
plt.savefig('Swarmplot.tif', dpi=300)

追記(2022年8月29日) 枠線を一部消す方法と、枠線の太さを調整する方法
グラフの見た目にこだわりたい場合、こういった要素も変更したいことと思う。
下記パラメータを変更することで、それを達成することができる。
#線の太さの変更
spines = 1.0
ax1.spines["top"].set_linewidth(spines)

#線の有無の変更
ax1.spines['top'].set_visible(False)

#'top'の箇所は 'bottom', 'right', 'left'のいずれにも変更可能
おわりに
スクリプト中の、"file_path"という変数の内容は、実行するデータによって変わるので注意してほしい。また"sns.boxplot()"の部分を"sns.violinvplot()"に変更するだけで、箱ヒゲ図をヴァイオリンプロットに変更することができる。

グラフをよく見ると、一部点同士が重なってしまっている部分があるので、これはもう少し綺麗にならないのだろうか?ご存知の方がいたらご教示願います。