はじめに
Grafana には Chaos Mesh 用の Data Source プラグインが存在します。ドキュメントだとこの辺りに記載があります。(https://chaos-mesh.org/docs/use-grafana-data-source/) 今回は、(私が不慣れなのもありますが)ドキュメントの参照だけでは、すんなり進まなかった部分もあるので、Grafana, Chaos Mesh の連携周りを丁寧に説明したいと思います。
若干ハマった点
- Grafana Labs で公開されている Chaos Mesh のプラグインはバージョンが低く Chaos Mesh の最新版(2.1.4)とは互換性がないこと
- これはドキュメントにも以下のように記載があり、「自分でプラグインを入れてね」とのこと
The Data Source plugin cannot be installed through grafana-cli at this time, because Grafana has not yet accepted the plugin submission for Chaos Mesh Data Source.
- これはドキュメントにも以下のように記載があり、「自分でプラグインを入れてね」とのこと
- Grafana をコンテナで構成している場合の手順がないので、Grafana Labs にないプラグインの入れ方や Unsigned なプラグインの許可の仕方を調べながら実施した点
- Chaos Mesh を Safe Mode で起動している場合の連携手順がなかったこと
手順
前提
- OKE(Oracle Container Engine for Kubernetes) 上に構築
- 大体一緒ですが、
StorageClassNameなど各ベンダーで異なる部分は良しなに修正してください
- 大体一緒ですが、
- Chaos Mesh が Safe Mode で構築済みであること
- Helm を使って構築すればデフォルトで Safe Mode になります
Grafana の構築
以下の Manifest ファイルを apply します。
grafana.yaml
apiVersion: v1
kind: PersistentVolumeClaim
metadata:
  name: grafana-pvc
  namespace: monitoring
spec:
  storageClassName: "oci-bv" # ... 1
  accessModes:
    - ReadWriteOnce
  resources:
    requests:
      storage: 50Gi
---
apiVersion: apps/v1
kind: Deployment
metadata:
  labels:
    app: grafana
  name: grafana
  namespace: monitoring
spec:
  selector:
    matchLabels:
      app: grafana
  template:
    metadata:
      labels:
        app: grafana
    spec:
      securityContext:
        fsGroup: 472
        supplementalGroups:
          - 0
      containers:
        - name: grafana
          image: grafana/grafana:8.4.4
          imagePullPolicy: IfNotPresent
          ports:
            - containerPort: 3000
              name: http-grafana
              protocol: TCP
          env:
            - name: GF_INSTALL_PLUGINS # ... 2
              value: "https://github.com/chaos-mesh/datasource/releases/download/v2.1.0/chaosmeshorg-datasource-2.1.0.zip;data/plugins"
            - name: GF_PLUGINS_ALLOW_LOADING_UNSIGNED_PLUGINS # ... 3
              value: "chaosmeshorg-datasource"
          readinessProbe:
            failureThreshold: 3
            httpGet:
              path: /robots.txt
              port: 3000
              scheme: HTTP
            initialDelaySeconds: 10
            periodSeconds: 30
            successThreshold: 1
            timeoutSeconds: 2
          livenessProbe:
            failureThreshold: 3
            initialDelaySeconds: 30
            periodSeconds: 10
            successThreshold: 1
            tcpSocket:
              port: 3000
            timeoutSeconds: 1
          resources:
            requests:
              cpu: 250m
              memory: 750Mi
          volumeMounts:
            - mountPath: /var/lib/grafana
              name: grafana-pv
      volumes:
        - name: grafana-pv
          persistentVolumeClaim:
            claimName: grafana-pvc
---
apiVersion: v1
kind: Service
metadata:
  name: grafana
  namespace: monitoring
spec:
  ports:
    - port: 3000
      protocol: TCP
      targetPort: http-grafana
  selector:
    app: grafana
  type: ClusterIP
---
apiVersion: networking.k8s.io/v1 # ... 4
kind: Ingress
metadata:
  name: grafana
  namespace: monitoring
  annotations:
    kubernetes.io/ingress.class: "nginx"
spec:
rules:
  - host: <your-host>
    http:
    paths:
      - backend:
        service:
        name: grafana
        port:
        number: 3000
        path: /
        pathType: Prefix
基本は、Deploy Grafana on Kubernetes で公開されている Manifest で良いのですが、いくつかポイントがあるので説明します。
- OKE specific な部分なので、各ベンダー仕様を参照してください
- コンテナで作る Grafana の環境に Grafana Labs で公開されていないプラグインを持ち込みたい場合の口が、環境変数として用意されています。形式は、
<url to plugin zip>;<plugin install folder name>のように指定するので Chaos Mesh の場合は、https://github.com/chaos-mesh/datasource/releases/download/v2.1.0/chaosmeshorg-datasource-2.1.0.zip;data/pluginsと指定します。-
data/pluginsはカスタムプラグインのデフォルトの格納場所です -
custom-plugin,conf/data/pluginでも同様に動作するはず(※未検証)
-
- Unsigned なプラグインを使用したい場合、デフォルトでは使用することができないので、設定ファイル(
grafana.ini)を書き換える必要がありますが、コンテナ環境なので read-only となっています。こちらも同様に環境変数として、上書きできる口が用意されているのでそれを使います。形式は、GF_<SectionName>_<KeyName>のように指定するので、Chaos Mesh のプラグインを許可する場合は、GF_PLUGINS_ALLOW_LOADING_UNSIGNED_PLUGINSのように name を指定し、その値はchaosmeshorg-datasourceとします - 個人的な都合で Ingress を使って公開していますが、
type: LoadBalancerでそのまま公開しても OK です
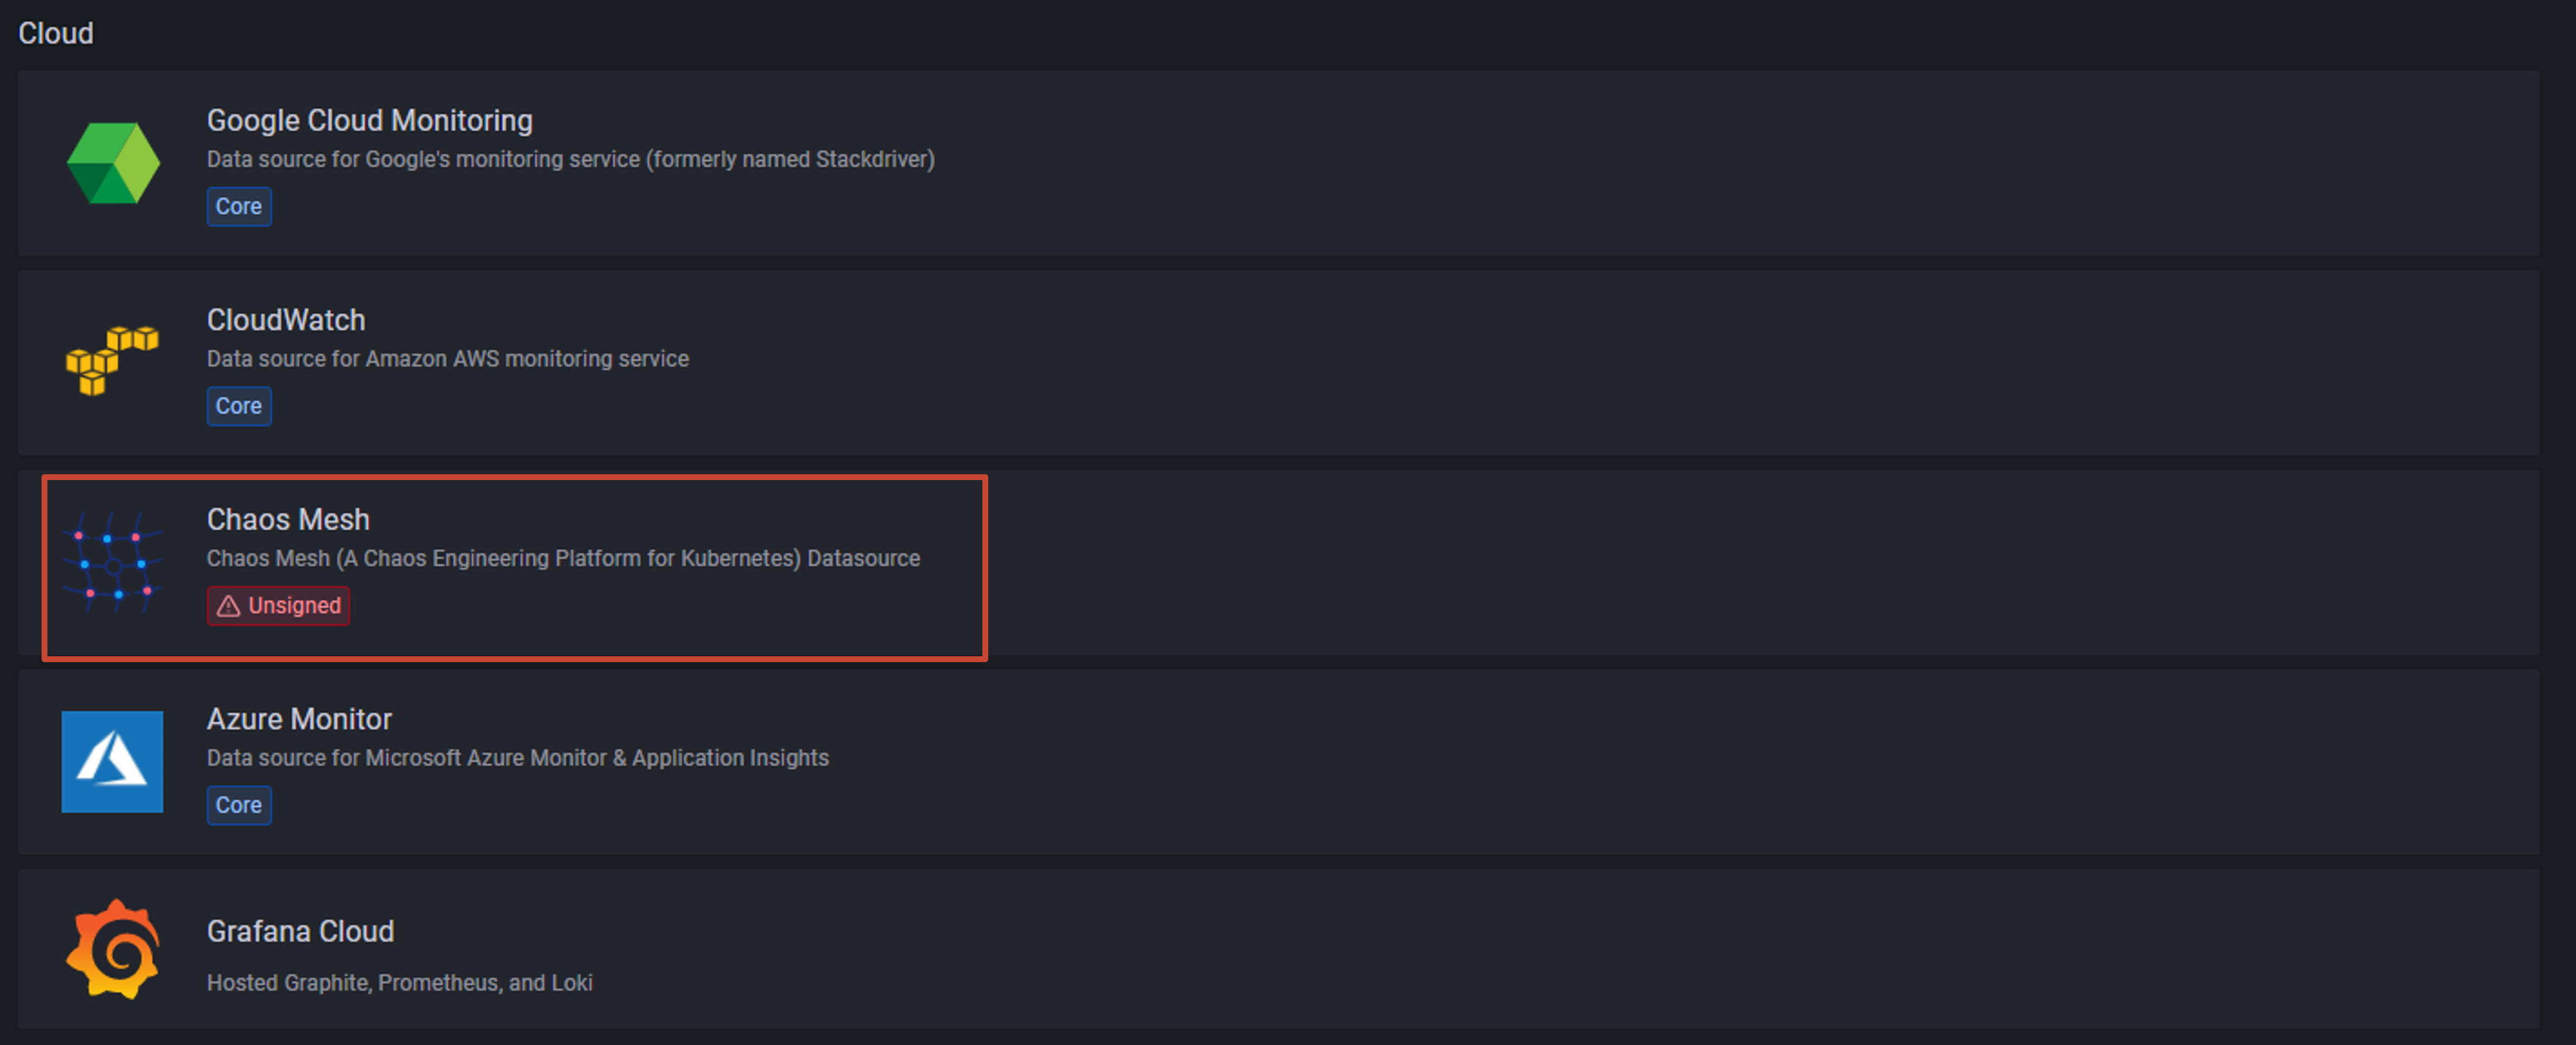
構築が完了すると、Configuration > Data Source に Chaos Mesh が追加されていることが確認できます。
以下のように入力します。(指定のない箇所は入力は不要です)
- URL: Chaos Mesh のエンドポイント
- Custom HTTP Headers
Authorization: Bearer eyJ...- Safe Mode で起動した Chaos Mesh にログインする際に使用したトークンを指定してください
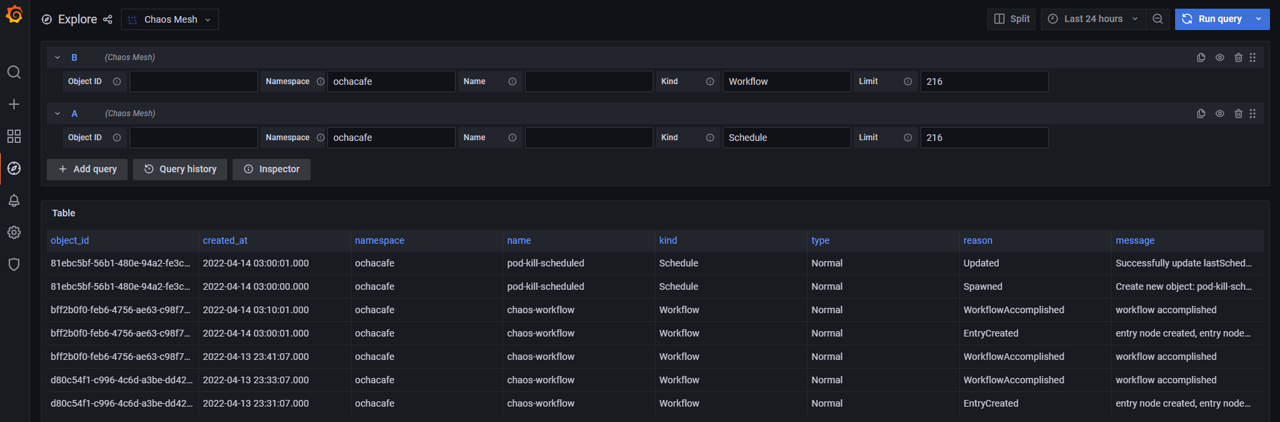
Explore で以下のように、Chaos Mesh のイベントが参照できれば OK です!