はじめに
今回はPyTrochでCUDAを使った場合のプロファイル取得について調べたことのまとめです。
今回は主に自分の学習コードのどのあたりに時間がかかっているのか?という観点を調べることを目的としたプロファイルの取得方法について説明します。
CUDAの関数自体の高速化するために取得するようなプロファイルについては今回は言及しません。ご了承ください。
PyTorchにおけるプロファイラ
PyTorchのコードのCUDAのプロファイルを取得する場合、以下の二つのパターンが考えられます。
- PyTorchが提供しているプロファイラを利用する
- CUDAが提供しているプロファイラを利用する
今回はそれぞれについて説明します。
PyTorchが提供しているプロファイラについて
PyTorchは主に以下のプロファイル取得方法があります。
torch.autograd.profiler.profiletorch.utils.bottleneck
今回はtorch.autograd.profiler.profileについて詳しく紹介します。
torch.utils.bottleneck のほうはCUDAのプロファイルが正しく取得できないため、今回は利用しません。
torch.utils.bottleneckについて詳しく知りたい方はPyTorchの公式ドキュメントを参照してください。
CUDAが提供しているプロファイラについて
CUDAのプロファイラとしては主に以下のものがあります。
- Nsight Systems
- Nsight Computing
- nvprof (+ nvvp)
このうち、今回はNsight Systemsを利用した場合を紹介します。
Nsight Systemsはプログラム全体でどの部分が遅いか?をタイムライン表示で解析するためのツールです。
一方、Nsight ComputingはCUDAの関数のどこに時間がかかっているかなどを詳しく調べるためのツールで、CUDAを書いている場合は非常に有用なのですが、今回は省きます。
また、nvprof に関してはAmpereからサポート外になったため、今後使われなくなると考え、nvprofについても省きます。
今回の検証環境
今回使用した環境は以下の通りです。
- GPU: V100
- PyTorch: 1.7.1
- CUDA: 11.1
- Nsight Systems: 2020.5.1.85-5ee086b
また、プロファイルを取るにあたり作成したコードは以下のところに置いておきました。
https://github.com/shu65/pytorch-profile-example
実際に自分でも動かす場合は参考にしてみてください。
torch.autograd.profiler.profile について
torch.autograd.profiler.profileの機能としては様々なものがありますが、大きく分けると以下のものがあります。
- CPU/GPUの両方をサポートした計算時間プロファイル機能
- メモリ使用量のプロファイル機能
この二つを分けてそれぞれ使い方を説明します。
torch.autograd.profiler.profileによる計算時間プロファイル
torch.autograd.profiler.profileによる簡単な計算時間プロファイルの取得方法
ここではtorch.autograd.profiler.profileを利用して、学習ループのどの部分に時間がかかっているか?を調べることを想定したプロファイルの取り方について説明します。
torch.autograd.profiler.profile を利用すると以下のようにしてプロファイルが取得できます。
with profiler.profile(use_cuda=True) as prof:
  ...
CUDAのプロファイルをする場合は、profile() で use_cuda=True とする必要があります。
また、任意の箇所のプロファイルを取得したい場合は 以下のようにrecord_function() を利用することで取得できます。
with profiler.record_function("forward"):
  output = model(data)
このようにすると forward という項目がプロファイルに出力されるようになります。
プロファイル結果を表示する方法として以下の二つがあります。
- 項目毎に集計して表示
- chromeのtraceを使って表示
1の「項目毎に集計して表示」を行う場合は以下のように key_averages() 等を利用して集計し表示するという流れになります。
print(prof.key_averages().table(sort_by="cuda_time_total", row_limit=10))
この出力結果は以下のようになります。
$ python3 profiler-time-example.py --iterations 100
train end

-------------------------------------------  ------------  ------------  ------------  ------------  ------------  ------------  ------------  ------------  ------------  ------------
                                       Name    Self CPU %      Self CPU   CPU total %     CPU total  CPU time avg     Self CUDA   Self CUDA %    CUDA total  CUDA time avg    # of Calls
-------------------------------------------  ------------  ------------  ------------  ------------  ------------  ------------  ------------  ------------  ------------  ------------
                                aten::copy_        36.01%        4.212s        36.01%        4.212s     158.838us        4.244s        37.56%        4.244s     160.034us         26518
                           aten::pin_memory         0.06%       7.435ms        33.53%        3.922s      19.224ms       8.289ms         0.07%        3.922s      19.224ms           204
                                   aten::eq         4.33%     506.395ms        12.29%        1.438s     110.110us     601.819ms         5.33%        1.436s     109.963us         13056
                                   backward         8.25%     965.346ms         8.32%     972.613ms       9.630ms        1.011s         8.95%        1.018s      10.081ms           101
                                   aten::to         3.84%     449.346ms         7.21%     843.457ms      25.603us     462.801ms         4.10%     724.012ms      21.977us         32944
                                   optimize         0.82%      95.700ms         6.16%     720.170ms       7.130ms      72.258ms         0.64%     678.842ms       6.721ms           101
                                 aten::item         3.20%     373.698ms         6.05%     707.116ms      36.103us     293.971ms         2.60%     627.118ms      32.019us         19586
                                    forward         0.37%      43.507ms         4.62%     540.527ms       5.352ms      49.364ms         0.44%     540.542ms       5.352ms           101
                                  aten::div         2.75%     321.713ms         3.87%     453.108ms      69.410us     339.689ms         3.01%     451.690ms      69.193us          6528
                                aten::clone         2.09%     244.785ms         3.18%     372.413ms      57.049us     352.073ms         3.12%     430.589ms      65.960us          6528
-------------------------------------------  ------------  ------------  ------------  ------------  ------------  ------------  ------------  ------------  ------------  ------------
Self CPU time total: 11.696s
CUDA time total: 11.299s
このとき sort_by で指定できるkeyとしては以下のものがあります。
cpu_time, cuda_time, cpu_time_total,
cuda_time_total, cpu_memory_usage, cuda_memory_usage,
self_cpu_memory_usage, self_cuda_memory_usage, count.
詳しくはPyTorchの公式ドキュメントをご覧ください。
2のchromeのtraceを使って表示させるには export_chrome_trace() を利用してtrace用のファイルを出力させ、chromeで読み込むという流れになります。
こちらの詳しい使い方はPyTorchの公式ドキュメントをご覧ください。
torch.autograd.profiler.profileによるより詳細な計算時間プロファイルの取得方法
ここではより詳細のプロファイルの取得方法について説明します。
torch.autograd.profiler.profile() と key_averages() の引数を変更することで、より詳細なプロファイルを取得可能です。
具体的には以下の情報を付与して、集計することができます。
1. autogradのoperationの引数のshape (record_shapes=True)
2. 関数のソースコード情報 (with_stack=True )
3. 使用メモリ量 (profile_memory =True, 後ほど説明)
3に関しては後ほど説明するため、ここでは1と2について詳しく説明します。
autogradのoperationの引数のshapeの情報追加
torch.autograd.profiler.profile()で以下のようにrecord_shapes=Trueを追加することでautogradのoperationの引数で渡されたTensorのshapeの情報を追加できます。
具体的には以下のようにコードを変更します。
with profiler.profile(record_shapes=True, use_cuda=True) as prof:
  ...
また、出力する際には以下のように group_by_input_shape=True を追加することで、shapeの情報を利用して集計を行うようになります。
print(prof.key_averages(group_by_input_shape=True).table(sort_by="cuda_time_total", row_limit=10))
この出力結果は以下のようになります。
$ python3 profiler-time-shape-example.py --iterations 100
train end
-------------------------------------------  ------------  ------------  ------------  ------------  ------------  ------------  ------------  ------------  ------------  ------------  ---------------------------------------------
                                       Name    Self CPU %      Self CPU   CPU total %     CPU total  CPU time avg     Self CUDA   Self CUDA %    CUDA total  CUDA time avg    # of Calls                                   Input Shapes
-------------------------------------------  ------------  ------------  ------------  ------------  ------------  ------------  ------------  ------------  ------------  ------------  ---------------------------------------------
                           aten::pin_memory         0.39%      48.136ms        30.92%        3.824s      37.491ms      48.506ms         0.41%        3.824s      37.492ms           102                              [[64, 1, 28, 28]]
                                aten::copy_        30.52%        3.775s        30.52%        3.775s      18.596ms        3.775s        31.52%        3.775s      18.596ms           203         [[64, 1, 28, 28], [64, 1, 28, 28], []]
                                   backward        11.71%        1.448s        12.02%        1.487s      14.725ms        1.488s        12.43%        1.527s      15.120ms           101                                             []
                                   optimize         0.87%     108.034ms         8.34%        1.032s      10.218ms     151.563ms         1.27%     997.908ms       9.880ms           101                                             []
                                   aten::eq         2.31%     286.277ms         6.23%     770.021ms     117.957us     291.996ms         2.44%     768.777ms     117.766us          6528                                      [[1], []]
                                 aten::item         1.56%     192.945ms         5.28%     653.384ms      33.360us     325.270ms         2.72%     720.773ms      36.800us         19586                                           [[]]
                                  aten::div         3.18%     393.805ms         4.95%     612.701ms      93.857us     413.955ms         3.46%     611.909ms      93.736us          6528                              [[1, 28, 28], []]
                                  aten::any         4.13%     511.035ms         4.58%     567.083ms      86.869us     469.385ms         3.92%     502.188ms      76.928us          6528                                          [[1]]
                                    forward         0.42%      51.842ms         3.88%     479.755ms       4.750ms      59.084ms         0.49%     479.769ms       4.750ms           101                                             []
                                   aten::eq         1.11%     136.820ms         3.86%     477.036ms      73.075us     148.303ms         1.24%     476.782ms      73.036us          6528                                 [[0], [1], []]
-------------------------------------------  ------------  ------------  ------------  ------------  ------------  ------------  ------------  ------------  ------------  ------------  ---------------------------------------------
Self CPU time total: 12.369s
CUDA time total: 11.976s
関数のソースコード情報追加
PyTorch 1.7から追加された機能で、ソースコードの情報もプロファイル結果に追加できるようになりました。
使い方としては以下のようにtorch.autograd.profiler.profile()に with_stack=True を追加します。
with profiler.profile(use_cuda=True, with_stack=True) as prof:
  ...
また、出力する際には以下のように group_by_stack_n で1以上の値を指定してます。
print(prof.key_averages(group_by_stack_n=2).table(sort_by="cuda_time_total", row_limit=10))
このときの出力結果は以下のようになります。
$  python3 profiler-time-stack-example.py --iterations 100
train end
-------------------------------------------  ------------  ------------  ------------  ------------  ------------  ------------  ------------  ------------  ------------  ------------  ---------------------------------------------------------------------------
                                       Name    Self CPU %      Self CPU   CPU total %     CPU total  CPU time avg     Self CUDA   Self CUDA %    CUDA total  CUDA time avg    # of Calls  Source
Location
-------------------------------------------  ------------  ------------  ------------  ------------  ------------  ------------  ------------  ------------  ------------  ------------  ---------------------------------------------------------------------------
                                   aten::eq         3.95%     687.652ms        18.77%        3.270s     250.435us     931.693ms         5.77%        3.200s     245.095us         13056  /home/shu/.local/lib/python3.8/site-packages/torch/tensor.py(27): wra
                                                                                                                                                                                         /home/shu/.local/lib/python3.8/site-packages/torchvision/transforms/f


                                   backward        10.65%        1.855s        11.14%        1.941s      19.222ms        1.902s        11.77%        1.987s      19.677ms           101  /home/shu/.local/lib/python3.8/site-packages/torch/autograd/profiler.
                                                                                                                                                                                         profiler-time-stack-example.py(91): main


                           aten::pin_memory         0.05%       9.201ms        11.21%        1.952s       9.571ms      13.476ms         0.08%        1.952s       9.571ms           204  /home/shu/.local/lib/python3.8/site-packages/torch/utils/data/_utils/
                                                                                                                                                                                         /home/shu/.local/lib/python3.8/site-packages/torch/utils/data/_utils/


                                aten::copy_        11.05%        1.925s        11.05%        1.925s       9.435ms        1.925s        11.91%        1.925s       9.435ms           204  /home/shu/.local/lib/python3.8/site-packages/torch/utils/data/_utils/
                                                                                                                                                                                         /home/shu/.local/lib/python3.8/site-packages/torch/utils/data/_utils/


                                   optimize         0.65%     113.814ms         8.09%        1.410s      13.962ms      97.644ms         0.60%        1.372s      13.585ms           101  /home/shu/.local/lib/python3.8/site-packages/torch/autograd/profiler.
                                                                                                                                                                                         profile-time-stack-example.py(93): main


                                   aten::to         1.76%     307.122ms         7.16%        1.247s      95.526us     758.014ms         4.69%        1.246s      95.439us         13056  /home/shu/.local/lib/python3.8/site-packages/torchvision/transforms/f
                                                                                                                                                                                         /home/shu/.local/lib/python3.8/site-packages/torchvision/transforms/t


                                  aten::div         2.48%     432.082ms         5.24%     912.273ms     139.748us     549.659ms         3.40%     914.464ms     140.083us          6528  /home/shu/.local/lib/python3.8/site-packages/torchvision/transforms/f
                                                                                                                                                                                         /home/shu/.local/lib/python3.8/site-packages/torchvision/transforms/t
                                    forward         0.26%      44.749ms         5.06%     881.714ms       8.730ms      47.009ms         0.29%     881.733ms       8.730ms           101  /home/shu/.local/lib/python3.8/site-packages/torch/autograd/profiler.
                                                                                                                                                                                         profile-time-stack-example.py(88): main


                                  aten::any         1.94%     337.787ms         4.95%     862.687ms     132.152us     744.088ms         4.61%     862.199ms     132.077us          6528  /home/shu/.local/lib/python3.8/site-packages/torchvision/transforms/f
                                                                                                                                                                                         /home/shu/.local/lib/python3.8/site-packages/torchvision/transforms/t


                           aten::is_nonzero         1.20%     209.241ms         4.69%     817.476ms     125.226us     205.717ms         1.27%     813.803ms     124.663us          6528  /home/shu/.local/lib/python3.8/site-packages/torchvision/transforms/f
                                                                                                                                                                                         /home/shu/.local/lib/python3.8/site-packages/torchvision/transforms/t


-------------------------------------------  ------------  ------------  ------------  ------------  ------------  ------------  ------------  ------------  ------------  ------------  ---------------------------------------------------------------------------
Self CPU time total: 17.422s
CUDA time total: 16.157s
torch.autograd.profiler.profileによるメモリ使用量のプロファイル
torch.autograd.profiler.profile でprofile_memory =Trueを指定するとメモリに関してもプロファイルが取得できるようになります。
具体的には以下のようにします。
with profiler.profile(profile_memory=True, use_cuda=True) as prof:
  ...
また、使用メモリ順でソートする場合は以下のようにします。
print(prof.key_averages().table(sort_by="cuda_memory_usage", row_limit=10))
この出力結果としては以下のようになります。
$ python3 profiler-memory-example.py --iterations 100
train end
-------------------------------------------  ------------  ------------  ------------  ------------  ------------  ------------  ------------  ------------  ------------  ------------  ------------  ------------  ------------  ------------
                                       Name    Self CPU %      Self CPU   CPU total %     CPU total  CPU time avg     Self CUDA   Self CUDA %    CUDA total  CUDA time avg       CPU Mem  Self CPU Mem
CUDA Mem  Self CUDA Mem    # of Calls
-------------------------------------------  ------------  ------------  ------------  ------------  ------------  ------------  ------------  ------------  ------------  ------------  ------------  ------------  ------------  ------------
                                aten::empty         3.87%     462.909ms         3.87%     462.909ms      11.866us       0.000us         0.00%       0.000us       0.000us     713.25 Kb     713.25 Kb      17.54 Gb      17.54 Gb         39010
                                    forward         1.37%     163.350ms         4.75%     568.503ms       5.629ms     157.484ms         1.38%     568.508ms       5.629ms        -404 b     -27.22 Kb
3.59 Gb    -230.70 Mb           101
                                 aten::relu         0.06%       7.108ms         0.43%      51.225ms     169.058us       5.186ms         0.05%      51.369ms     169.534us           0 b           0 b
1.45 Gb           0 b           303
                            aten::threshold         0.35%      41.486ms         0.37%      44.117ms     145.599us      46.183ms         0.40%      46.183ms     152.420us           0 b           0 b
1.45 Gb           0 b           303
                              ReluBackward0         0.03%       3.702ms         0.19%      22.506ms      74.278us       2.423ms         0.02%      22.362ms      73.803us           0 b           0 b
1.45 Gb           0 b           303
                   aten::threshold_backward         0.10%      12.177ms         0.16%      18.804ms      62.059us      19.939ms         0.17%      19.939ms      65.806us           0 b           0 b
1.45 Gb           0 b           303
                               aten::conv2d         0.02%       2.090ms         1.30%     155.590ms     770.245us       1.775ms         0.02%     166.355ms     823.540us           0 b           0 b
1.41 Gb           0 b           202
                          aten::convolution         0.02%       2.067ms         1.28%     153.500ms     759.900us       1.835ms         0.02%     164.580ms     814.755us           0 b           0 b
1.41 Gb           0 b           202
                         aten::_convolution         0.05%       6.468ms         1.27%     151.433ms     749.669us       5.203ms         0.05%     162.746ms     805.673us           0 b           0 b
1.41 Gb           0 b           202
                    aten::cudnn_convolution         0.76%      91.494ms         0.82%      97.826ms     484.289us     110.444ms         0.97%     111.986ms     554.384us           0 b           0 b
1.41 Gb      -3.35 Gb           202
-------------------------------------------  ------------  ------------  ------------  ------------  ------------  ------------  ------------  ------------  ------------  ------------  ------------  ------------  ------------  ------------
Self CPU time total: 11.960s
CUDA time total: 11.411s
NSight SystemsとNVTXを利用したプロファイル
torch.autograd.profiler.emit_nvtx() を利用した基本的なプロファイルの取得方法
PyTorchではNVTXのrangeを指定してautograd operationがいつからいつまで実行していたかをNsight Systemsでタイムライン表示するためのtorch.autograd.profiler.emit_nvtx()というものがあります。
これは以下のように利用します。
with torch.autograd.profiler.emit_nvtx():
  ...
また、PyTorchの学習コードは学習ループの前後でプロファイルを取る必要のない部分が存在する場合があります。この部分を省いて、指定した範囲だけプロファイルを取得することも可能です。この場合、学習コードの変更とNsight Systemsの nsys で追加の引数を指定する必要があります。
まず、コードのほうは以下のようにします。
with torch.cuda.profiler.profile(), torch.autograd.profiler.emit_nvtx():
  ...
これにより torch.cuda.profiler.profile() の範囲のみプロファイルを取得することができます。
Context Managerを利用しないでnsysのプロファイルの開始と終了を指定したい場合は、torch.cuda.profiler.start()とtorch.cuda.profiler.stop()というものも用意されているので、そちらを利用してください。
また、nsys のほうは以下のように -c cudaProfilerApi を指定することでプログラム内で指定された部分のみプロファイルを取得することができます。
nsys profile -c cudaProfilerApi python3 nsys-nvtx-example.py
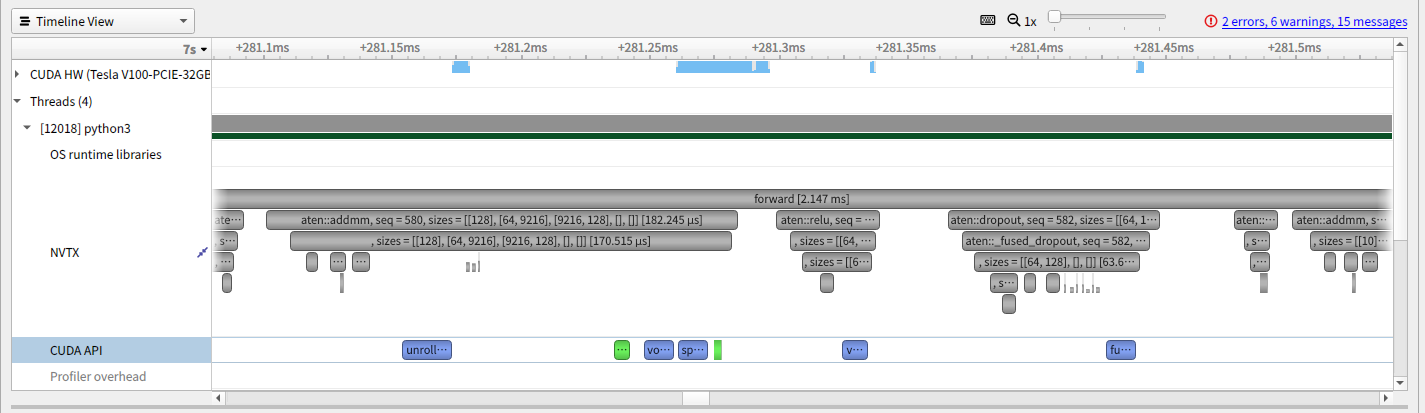
これによって出力されたファイルを nsys-ui で表示すると、以下のようにNVTXの列に関数が実行された範囲が指定されるようになります。
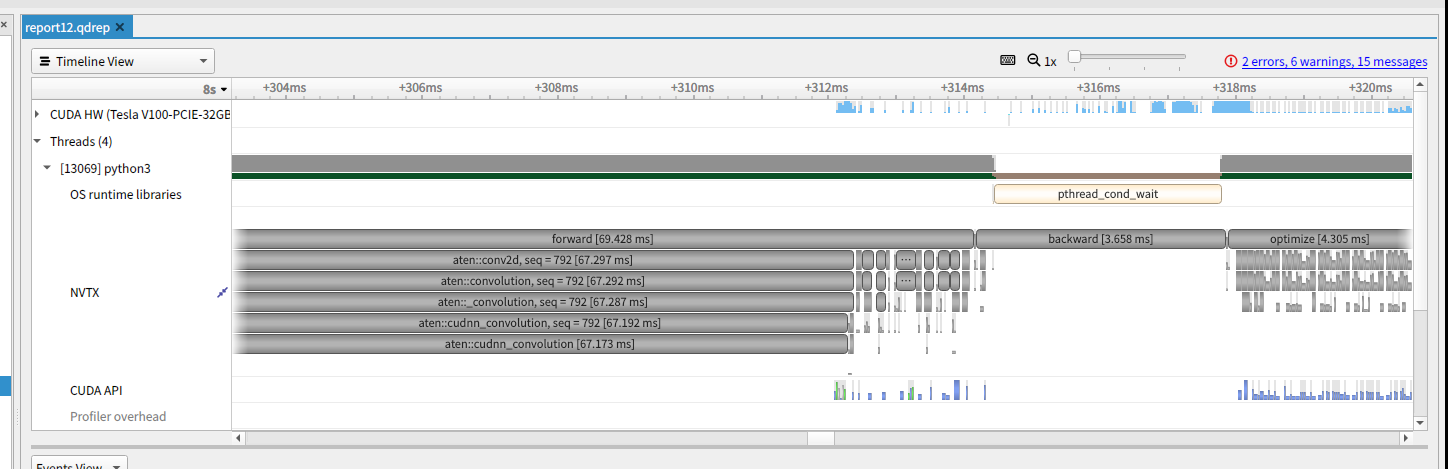
また、torch.autograd.profiler.emit_nvtx() で record_shapes=True を指定することで、shapeの情報を付与することができます。結果としては以下のようになります。
任意のNVTX rangeを指定する方法
nsysの結果を見ていると任意の範囲を指定したくなります。PyTorchでは record_function() で指定されている範囲に対してもNVTXのrangeが挿入されています。
これは以下のようにして利用することができます。
with profiler.record_function("forward"):
  output = model(data)
また、Context Manager以外の方法として、torch.cuda.nvtx.range_push() と torch.cuda.nvtx.range_pop() を利用する方法もあります。
これは以下のようにして利用します。
torch.cuda.nvtx.range_push("forward")
output = model(data)
torch.cuda.nvtx.range_pop()
終わりに
今回はPyTorchが提供している機能を使ってCUDAのプロファイルを取得する方法を紹介しました。
今回紹介した内容の一部は参考資料に載せた「PyTorch Developer Day 2020」や「PyTorch Tutorials」のほうでも紹介されていますので参考にしてみてください。
今回のまとめが少しで皆さんの参考になれば幸いです。
参考資料
- PyTorch Developer Day 2020: https://youtu.be/jaPVoObpdO0
- PyTorch Profiler — PyTorch Tutorials documentation: https://pytorch.org/tutorials/recipes/recipes/profiler.html