やりたい事
scipy.interpolate.griddataの使い方説明
x,y座標、及びその座標での値データがあるとします。
print(sample_df)
# >>>
#      X   Y  value
# 0    0   0     11
# 1    0   2     17
# 2    0   4     13
# 3    0   6     12
# 4    0   8     26
# ...
# 32  10   4      8
# 33  10   6     35
# 34  10   8     30
# 35  10  10     17
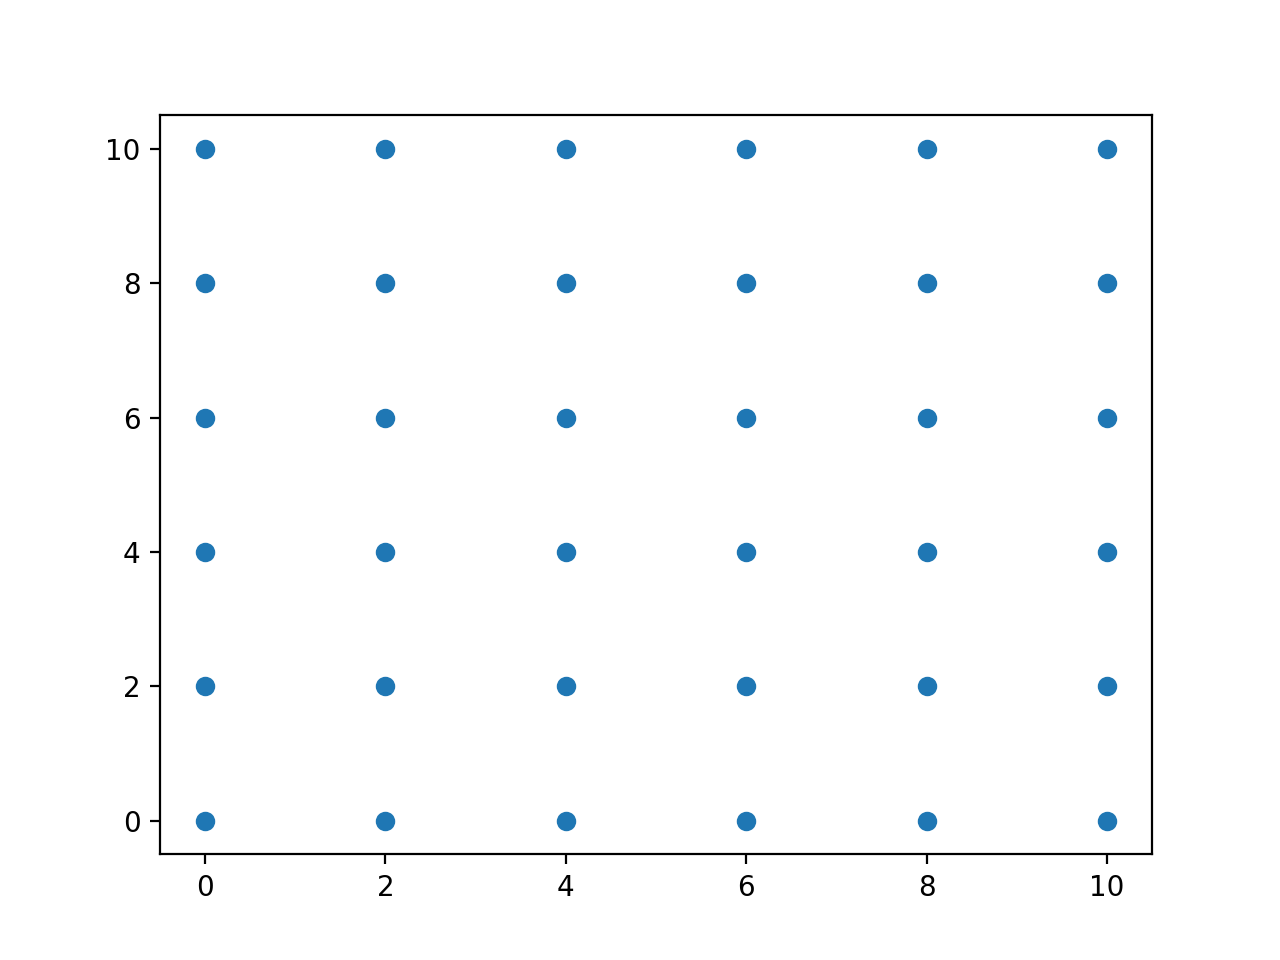
x,y座標のみをプロット
import matplotlib.pyplot as plt
import pandas as pd

fig = plt.figure()
ax1 = fig.add_subplot(111)
ax1.scatter(sample_df['X'], sample_df['Y'])
plt.show()
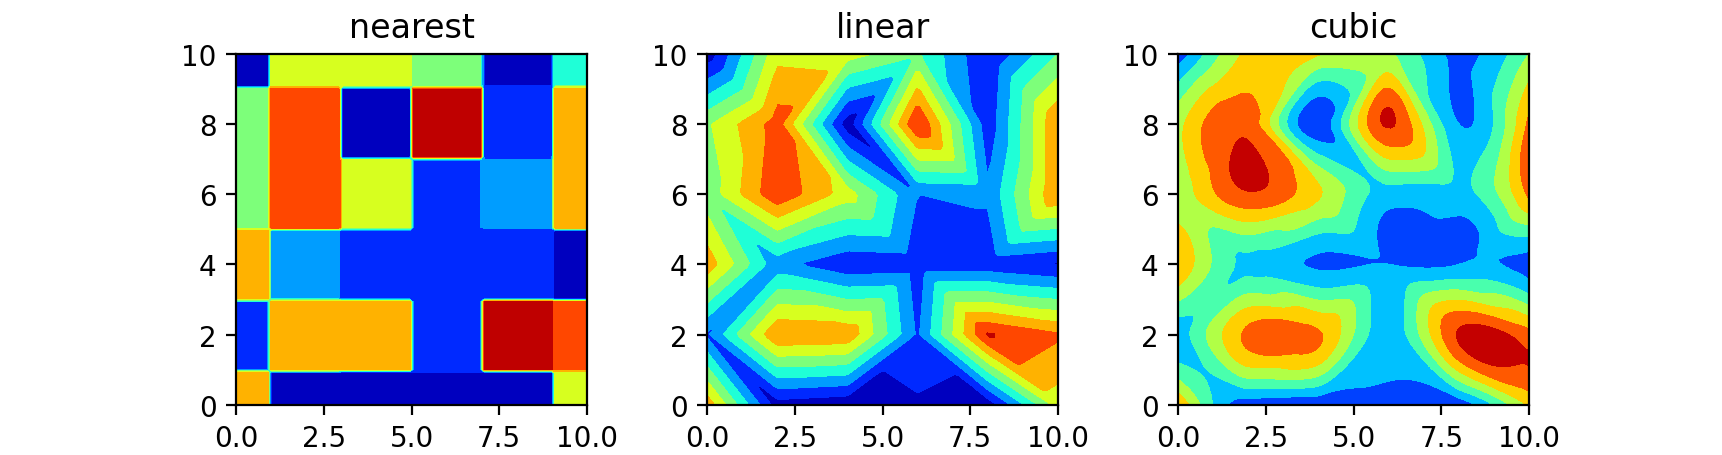
scipy.interpolate.griddataを使って座標とvaluesの空白部分を補間します。
結果は等高線マップで確認していきます。
補間したデータ
環境
Mac OS
Python 3.8.1
matplotlib 3.3.2
numpy 1.19.2
pandas 1.1.3
scipy 1.6.0
pip install matplotlib numpy pandas scipy
詳細
サンプルデータ
以下をサンプルデータとして使用します。
import itertools

import numpy as np
import pandas as pd

# sample data
x_coord_range = [i for i in range(0, 11, 2)]
y_coord_range = [i for i in range(0, 11, 2)]

xy_coord = list(itertools.product(x_coord_range, y_coord_range))
values = np.random.randint(1, 50, len(xy_coord))

sample_df = pd.DataFrame()
sample_df['X'] = [xy[0] for xy in xy_coord]
sample_df['Y'] = [xy[1] for xy in xy_coord]
sample_df['value'] = values

print(sample_df)
# >>>
#      X   Y  value
# 0    0   0     11
# 1    0   2     17
# 2    0   4     13
# 3    0   6     12
# 4    0   8     26
# ...
# 32  10   4      8
# 33  10   6     35
# 34  10   8     30
# 35  10  10     17
コード
sample_dfの中身は分からない想定です
import itertools  # サンプルデータ作成にのみ使用

import matplotlib.pyplot as plt
import numpy as np
import pandas as pd
from scipy.interpolate import griddata

# サンプルデータ作成個所は省略

# データ範囲を取得
x_min, x_max = sample_df['X'].min(), sample_df['X'].max()
y_min, y_max = sample_df['Y'].min(), sample_df['Y'].max()

# 取得したデータ範囲で新しく座標にする配列を作成
new_x_coord = np.linspace(x_min, x_max, 100)
new_y_coord = np.linspace(y_min, y_max, 100)

# x, yのグリッド配列作成
xx, yy = np.meshgrid(new_x_coord, new_y_coord)

# 既知のx, y座標, その値取得
knew_xy_coord = sample_df[['X', 'Y']].values
knew_values = sample_df['value'].values

# 座標間のデータを補間, method='nearest', 'linear' or 'cubic'
result = griddata(points=knew_xy_coord, values=knew_values, xi=(xx, yy), method='cubic')

# グラフ表示
fig = plt.figure()
ax = fig.add_subplot(111)
ax.set_aspect('equal', adjustable='box')
ax.contourf(xx, yy, result, cmap='jet')
plt.show()
データ範囲取得、新しい座標作成
# データ範囲を取得
x_min, x_max = sample_df['X'].min(), sample_df['X'].max()
# >>> 今回は x_min = 0, x_max = 10
y_min, y_max = sample_df['Y'].min(), sample_df['Y'].max()
# >>> 今回は y_min = 0, y_max = 10

# 取得したデータ範囲で新しく座標にする配列を作成
new_x_coord = np.linspace(x_min, x_max, 101)
# >>> [ 0.   0.1  0.2, ..., 10]
new_y_coord = np.linspace(y_min, y_max, 101)
# >>> [ 0.   0.1  0.2, ..., 10]
x, yの最大、最小値を取得して、実際のx, y2次元配列作成用の座標を作成します。
下表のような配列に補間値を入れていきたいのでnew_x_coord, new_y_coordはそれ用の
座標です
| 0 | 0.1 | 0.2 | ... | 10 | |
|---|---|---|---|---|---|
| 0 | val | val | val | ... | val |
| 0.1 | val | val | val | ... | val |
| 0.2 | val | val | val | ... | val |
| ... | ... | ... | ... | ... | val |
| 10 | val | val | val | ... | val |
np.grid
# x, yのグリッド配列作成
xx, yy = np.meshgrid(new_x_coord, new_y_coord)
ここが分かりやすいです。
配列の要素から格子列を生成するnumpy.meshgrid関数の使い方 - DeepAge
簡単にnp.meshgridで作成される配列の説明をすると、
import numpy as np

x = np.array([1, 2, 3])  # [x1, x2, x3]とする
y = np.array([1, 2, 3])  # [y1, y2, y3]とする
xx, yy = np.meshgrid(x, y)

xx=
array([[1, 2, 3],
       [1, 2, 3],
       [1, 2, 3]])
# xx=
# array([[x1, x2, x3],
#        [x1, x2, x3],
#        [x1, x2, x3]])


yy=
array([[1, 1, 1],
       [2, 2, 2],
       [3, 3, 3]])
# yy=
# array([[y1, y1, y1],
#        [y2, y2, y2],
#        [y3, y3, y3]])

# xxとyyを重ねるて見ると座標ができる
# array([[(1, 1),(2, 1),(3, 1)],
#        [(1, 2),(2, 2),(3, 2)],
#        [(1, 3),(2, 3),(3, 3)]])
# =
# array([[(x1, y1),(x2, y1),(x3, y1)],
#        [(x1, y2),(x2, y2),(x3, y2)],
#        [(x1, y3),(x2, y3),(x3, y3)]])
伝われ、、、
griddata
# 既知の座標とその値
knew_xy_coord = sample_df[['X', 'Y']].values
# >>>[[ 0  0]
#     [ 0  2]
#     ...
#     [10  8]
#     [10 10]]

knew_values = sample_df['value'].values
# >>> [14 32  4 35..., 9]

# 座標間のデータを補間, method='nearest', 'linear' or 'cubic'
result = griddata(points=knew_xy_coord, values=knew_values, xi=(xx, yy), method='cubic')
# >>> [[43.         40.16511073 37.34503184 ... 15.18228356 13.55766151 12.]
#      ...
#      [32.         30.91846813 29.83829943 ...  7.6922715   4.85443981 2. ]]
resultに補間された2次元配列が入ります。
scipy.interpolate.griddataの引数は
- points: 既知の座標
type=np.ndarray - values: pointsで入れた座標の値
type=np.ndarray - xi: x, yのグリッド配列
type=tuple(np.ndarray, np.ndarray) - method: 補間の種類指定
type=str,'nearest','linear'or'cubic' - fill_value: 補間できなかった座標の値を指定できる。
type=floatデフォルトはnan、'nearest'には効果なし - rescale: ???
pointsとvaluesの長さは一致していないとエラーが起きます。
補間の種類
- nearest: 再近隣内挿(補間したい点から最も近いデータ値を代入する)
- linear:線形補間
- cubic: (2次元配列の場合)3次スプライン補間

グラフ表示
fig = plt.figure()
ax = fig.add_subplot(111)
ax.set_aspect('equal', adjustable='box')
ax.contourf(xx, yy, result, cmap='jet')
plt.show()
座標有2次元配列なのでax.imshowではなくax.contourfを使用しています。
xのグリッド配列、yのグリッド配列、表示したい2次元配列の順に渡します。cmapはカラーマップの種類を指定しています。
ax.set_aspect('equal', adjustable='box')はxとyのアスペクト比を同じにしたいからです。