はじめに
初投稿です!よろしくお願い致します!
GUIの中にリアルタイムでグラフを描画する機会があり、その時のまとめです。
GUIはwxpythonで作成した為、同じwxモジュール内にあるwx.lib.plotを使用しました。
時間軸の記事を探すのに苦労したので参考になれば幸いです。
環境
mac OS
python 3.8.5
wxpython 4.1.0
インポート
pip install wxpython
でインストールできます
import wx
import wx.lib
import wx.lib.plot as plot
基本
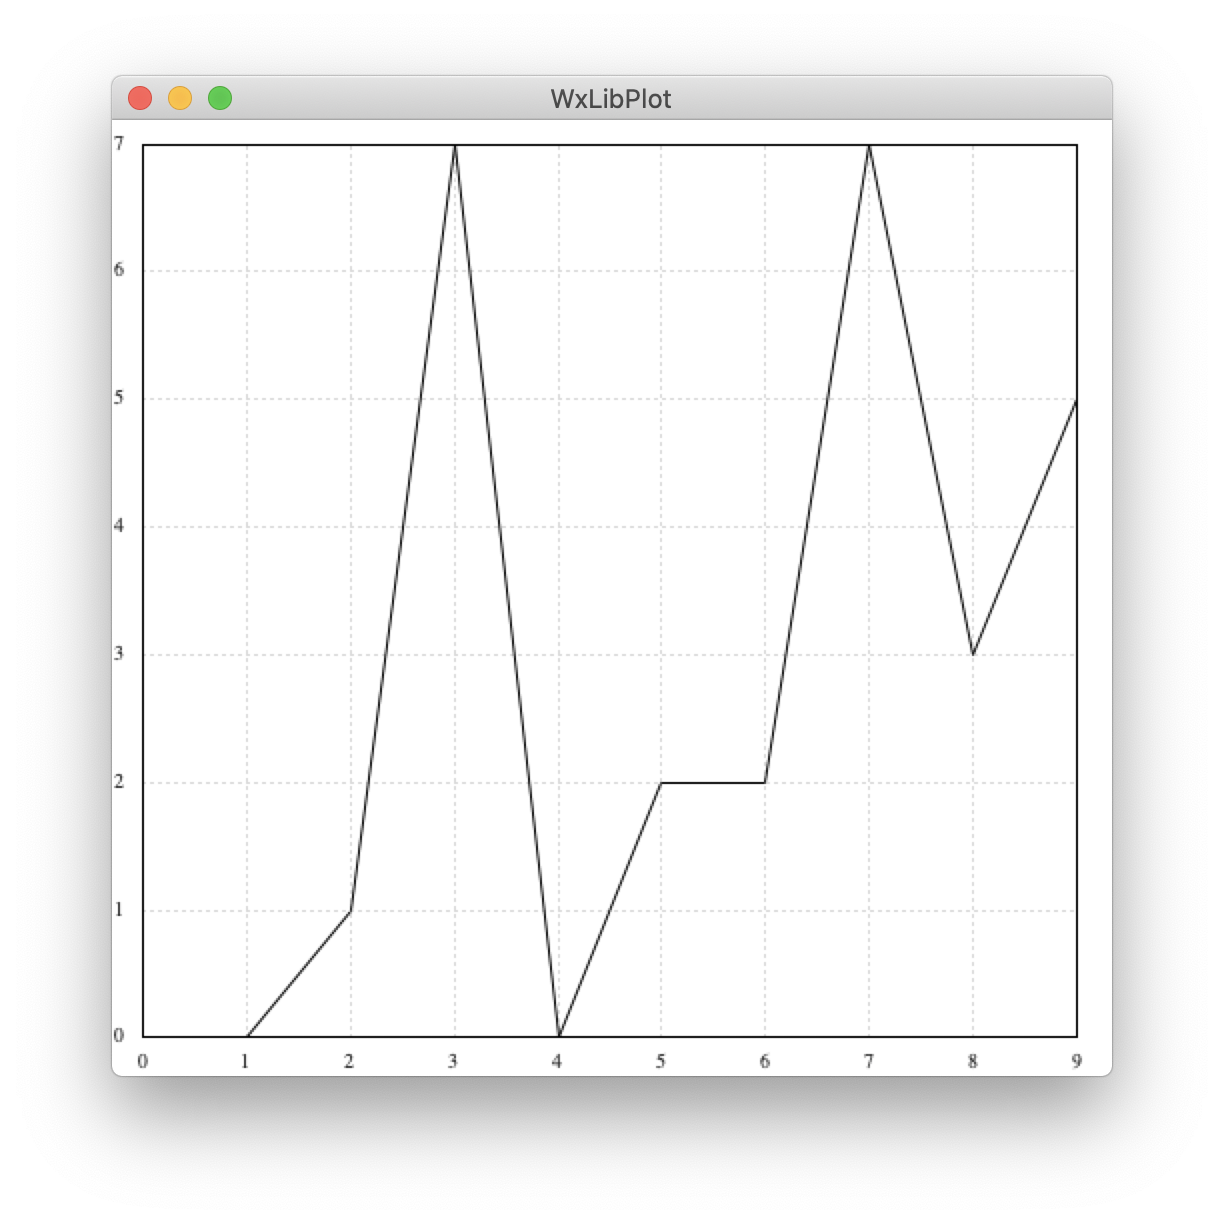
wx.Frame -> wx.Panel -> plot.Canvasの順に配置していきます。
import wx
import wx.lib
import wx.lib.plot as plot
# グラフ描画に使用
import random

# 描画する値
x_val = list(range(10))
y_val = [random.randint(0, 10) for i in range(10)]  # 0~10までのランダムな値10個

# [(x1, y1), (x2, y2),...(xn, yn)]という形式でグラフに渡すため変形
xy_val = list(zip(x_val, y_val))


class MainFrame(wx.Frame):
    def __init__(self, parent, id, title):
        wx.Frame.__init__(self, parent, id, title, size=(500, 500))
        # panel作成
        self.panel = wx.Panel(self, -1)
        # graph作成
        self.plotter = plot.PlotCanvas(self, -1)
        # 表示する線を作成 & 描画
        line = plot.PolyLine(xy_val)
        gc = plot.PlotGraphics([line])
        self.plotter.Draw(gc)

        # sizer作成 & 設置
        sizer = wx.GridSizer(1, 1, gap=(0, 0))
        sizer.Add(self.plotter, flag=wx.EXPAND)
        self.SetSizer(sizer)

        # 画面中央にGUIを表示
        self.Center()
        self.Show()


def main():
    app = wx.App()
    MainFrame(None, -1, 'WxLibPlot')
    app.MainLoop()


if __name__ == '__main__':
    main()
結果
レイアウト
グラフタイトル、凡例、ラベルの追加
ズーム or ドラッグ機能の有効化
フォントサイズ、線の色、太さを変更します
ズームとドラッグは共存できない為、片方を有効にするともう片方は無効になります。
上記コードのself.plotter = plot.PlotCanvas(self, -1)下を下記に変更します。
self.plotter.enableLegend = True  # 凡例表示をTrueにする
self.plotter.fontSizeTitle = 18  # グラフタイトルの文字サイズを18にする(デフォルト=15)
self.plotter.fontSizeLegend = 18  # 凡例の文字サイズを18にする(デフォルト=7)
self.plotter.fontSizeAxis = 18  # xyラベル, 座標の文字サイズを18にする(デフォルト=10)

# ズーム or ドラッグ機能を有効にする。どちらか片方しか有効にできない
# self.plotter.enableZoom = True
self.plotter.enableDrag = True

# 表示する線を作成 & 描画()
line = plot.PolyLine(xy_val, legend='sample', colour='red', width=4)  # 凡例文字追加、線の色を赤、太さを4に変更
gc = plot.PlotGraphics([line], 'WxLibPlot', 'xaxis', 'yaxis')  # グラフタイトル、xyラベル追加
結果
ドラッグを有効にしています。

リアルタイム描画
wx.Timerを利用して1秒置きにランダムな値を取る折れ線グラフを描画します。
今回はプロットの開始、終了を制御するボタンを追加しています。
import wx
import wx.lib
import wx.lib.plot as plot
# グラフ描画に使用
import random


class MainFrame(wx.Frame):
    def __init__(self, parent, id, title):
        wx.Frame.__init__(self, parent, id, title, size=(500, 500))
        # panel作成
        self.panel = wx.Panel(self, -1)
        # 測定開始、停止用ボタン
        self.start_button = wx.Button(self, -1, label='start')
        self.stop_button = wx.Button(self, -1, label='stop')
        # graph作成
        self.plotter = plot.PlotCanvas(self, -1)
        # plot点の初期値
        self.x_val = 0
        self.xy_val = []

        self.plotter.enableLegend = True  # 凡例表示をTrueにする
        self.plotter.fontSizeTitle = 18  # グラフタイトルの文字サイズを18にする(デフォルト=15)
        self.plotter.fontSizeLegend = 18  # 凡例の文字サイズを18にする(デフォルト=7)
        self.plotter.fontSizeAxis = 18  # xyラベル, 座標の文字サイズを18にする(デフォルト=10)

        # ズーム or ドラッグ機能を有効にする。どちらか片方しか有効にできない
        # self.plotter.enableZoom = True
        # self.plotter.enableDrag = True

        # 表示する線を作成 & 描画()
        line = plot.PolyLine(self.xy_val, legend='sample', colour='red', width=2)  # 凡例文字追加、線の色を赤、太さを4に変更
        gc = plot.PlotGraphics([line], 'RealTimePlot', 'xaxis', 'yaxis')  # グラフタイトル、xyラベル追加
        self.plotter.Draw(gc)

        # フレームのタイマーを作成
        self.timer = wx.Timer(self)

        # sizer作成 & 設置
        sizer1 = wx.FlexGridSizer(2, 1, gap=(0, 0))  # 2行1列のグラフとsizer2を並べる用サイザー
        sizer2 = wx.GridSizer(1, 2, gap=(0, 0))  # 1行2列のボタンを並べる用サイザー

        sizer1.Add(self.plotter, flag=wx.EXPAND)  # flag=wx.EXPAND: 幅、高さを最大まで伸ばす
        sizer1.Add(sizer2, flag=wx.ALIGN_RIGHT)  # flag=wx.ALIGN_RIGHT: 右寄せに設置
        sizer1.AddGrowableCol(0)  # 1列目の幅を最大まで伸ばす
        sizer1.AddGrowableRow(0)  # 1行目の高さを最大まで伸ばす
        # ボタンの設置
        sizer2.Add(self.start_button)
        sizer2.Add(self.stop_button)

        self.SetSizer(sizer1)

        # イベント達
        self.start_button.Bind(wx.EVT_BUTTON, self.graph_start)
        self.stop_button.Bind(wx.EVT_BUTTON, self.graph_stop)
        self.Bind(wx.EVT_TIMER, self.graph_plot)

        # 画面中央にGUIを表示
        self.Center()
        self.Show()

    def graph_start(self, event):
        self.plotter.Clear()  # グラフを初期化
        self.x_val, self.xy_val = 0, []  # x_val, xy_valを初期化
        self.timer.Start(1000)

    def graph_stop(self, event):
        self.timer.Stop()

    def graph_plot(self, event):
        y_val = random.randint(0, 100)
        self.xy_val.append((self.x_val, y_val))
        line = plot.PolyLine(self.xy_val, legend='sample', colour='red', width=2)
        gc = plot.PlotGraphics([line], 'RealTimePlot', 'xaxis', 'yaxis')
        self.plotter.Draw(gc)
        self.x_val += 1


def main():
    app = wx.App()
    MainFrame(None, -1, 'WxLibPlot')
    app.MainLoop()


if __name__ == '__main__':
    main()
結果
スタートボタンを押した後一度白くなるのはグラフを初期化しているからです。

xSpecという属性を変更することで描画方法が変わります
self.plotter.xSpec = 'auto' # or 'min', int, (min, max), 'none'

上から、'auto', 'min', int, (min, max)となります。'auto'がデフォルトです。
整数型を代入した場合、'min'と動作は同じですが、座標表示が固定されます。上の例では、グラフを4分割してその境界上に座標を表示しています。
'none'はx軸、ラベルが消えるだけなので省略します。
時間軸表示
一番書きたかった個所です。早速ですが、コードと結果を記載します。
時間間隔は1秒にしています。
import datetime as dt
import random
import wx
import wx.lib
import wx.lib.plot as plot


class TimeAxisPlot(plot.PlotCanvas):
    def __init__(self, parent, id):
        plot.PlotCanvas.__init__(self, parent, id)
        # レイアウト関係を定義
        self.enableLegend = True
        self.fontSizeLegend = 18
        self.fontSizeAxis = 18
        self.xSpec = 4

        self.startDate = dt.datetime.now()
        self.data = []
        line = plot.PolyLine(self.data, legend='sample', colour='red')
        gc = plot.PlotGraphics([line], 'TimeAxisPlot', 'time', 'yaxis')
        self.Draw(gc)

    def _xticks(self, *args):
        ticks = plot.PlotCanvas._xticks(self, *args)
        # ticks = [(プロット点, 表示する文字), (),...()]
        new_ticks = []
        for tick in ticks:
            t = tick[0]
            time_value = self.startDate + dt.timedelta(seconds=t)
            time_value_str = time_value.strftime('%H:%M:%S')
            new_ticks.append([t, time_value_str])
            # new_ticks = [(プロット点, 時刻), (),...()]
            # 表示する文字を時刻に変更
        return new_ticks


class MainFrame(wx.Frame):
    def __init__(self, parent, id, title):
        wx.Frame.__init__(self, parent, id, title, size=(500, 500))
        # panel作成
        self.panel = wx.Panel(self, -1)
        # 測定開始、停止用ボタン
        self.start_button = wx.Button(self, -1, label='start')
        self.stop_button = wx.Button(self, -1, label='stop')
        # graph作成
        self.plotter = TimeAxisPlot(self, -1)
        # plot点の初期値
        self.x_val = 0
        self.xy_val = []

        self.plotter.enableLegend = True  # 凡例表示をTrueにする
        self.plotter.fontSizeTitle = 18  # グラフタイトルの文字サイズを18にする(デフォルト=15)
        self.plotter.fontSizeLegend = 18  # 凡例の文字サイズを18にする(デフォルト=7)
        self.plotter.fontSizeAxis = 18  # xyラベル, 座標の文字サイズを18にする(デフォルト=10)

        # 表示する線を作成 & 描画()
        line = plot.PolyLine(self.xy_val, legend='sample', colour='red', width=2)  # 凡例文字追加、線の色を赤、太さを4に変更
        gc = plot.PlotGraphics([line], 'RealTimePlot', 'xaxis', 'yaxis')  # グラフタイトル、xyラベル追加
        self.plotter.Draw(gc)

        # フレームのタイマーを作成
        self.timer = wx.Timer(self)

        # sizer作成 & 設置
        sizer1 = wx.FlexGridSizer(2, 1, gap=(0, 0))  # 2行1列のグラフとsizer2を並べる用サイザー
        sizer2 = wx.GridSizer(1, 2, gap=(0, 0))  # 1行2列のボタンを並べる用サイザー

        sizer1.Add(self.plotter, flag=wx.EXPAND)  # flag=wx.EXPAND: 幅、高さを最大まで伸ばす
        sizer1.Add(sizer2, flag=wx.ALIGN_RIGHT)  # flag=wx.ALIGN_RIGHT: 右寄せに設置
        sizer1.AddGrowableCol(0)  # 1列目の幅を最大まで伸ばす
        sizer1.AddGrowableRow(0)  # 1行目の高さを最大まで伸ばす
        # ボタンの設置
        sizer2.Add(self.start_button)
        sizer2.Add(self.stop_button)

        self.SetSizer(sizer1)

        # イベント達
        self.start_button.Bind(wx.EVT_BUTTON, self.graph_start)
        self.stop_button.Bind(wx.EVT_BUTTON, self.graph_stop)
        self.Bind(wx.EVT_TIMER, self.graph_plot)

        # 画面中央にGUIを表示
        self.Center()
        self.Show()

    def graph_start(self, event):
        self.plotter.Clear()  # グラフを初期化
        self.x_val, self.xy_val = 0, []  # x_val, xy_valを初期化
        self.timer.Start(1000)

    def graph_stop(self, event):
        self.timer.Stop()

    def graph_plot(self, event):
        y_val = random.randint(0, 100)
        self.xy_val.append((self.x_val, y_val))
        line = plot.PolyLine(self.xy_val, legend='sample', colour='red', width=2)
        gc = plot.PlotGraphics([line], 'RealTimePlot', 'xaxis', 'yaxis')
        self.plotter.Draw(gc)
        self.x_val += 1


def main():
    app = wx.App()
    MainFrame(None, -1, 'TimeAxisPlot')
    app.MainLoop()


if __name__ == '__main__':
    main()
結果

plot.Canvasを継承して新しいクラスを作成、x軸座標のメソッドをオーバーライドします。
ここで、
    def _xticks(self, *args):
        ticks = plot.PlotCanvas._xticks(self, *args)
        # ex)ticks = [(0, '0.0'), (0.5, '0.5'), (1.0, '1.0'), (1.5, '1.5'), (2.0, '2.0')]
        # [(x座標(float)), (x座標に表示する文字(str))...]
ticksは[(x座標(float)), (x座標に表示する文字(str))...]を返します。
この表示する文字を時刻に変更することで時間軸を作成しています。
方法
座標と時刻のタプルを作り、空リストnew_ticksにappendする
ex)スタート時刻:0:00, ticks= [(0, '0.0'), (0.5, '0.5'), (1.0, '1.0'), (1.5, '1.5'), (2.0, '2.0')]の時
for文1回目
- tick = (0, '0.0')
- t = 0
- スタート時刻にt秒ずれた日付を作成、strに変形(=00:00)
- (0, '00:00')をnew_ticksにappend
以下ループ
        new_ticks = []
        for tick in ticks:  # 取得したticksでループ
            # タプルの0番目(x座標点)を取得
            t = tick[0]
            time_value = self.startDate + dt.timedelta(seconds=t)
            time_value_str = time_value.strftime('%H:%M:%S')
            new_ticks.append([t, time_value_str])
            # new_ticks = [(プロット点, 時刻), (),...()]
            # 表示する文字を時刻に変更
        return new_ticks
最後に
読んで頂きありがとうございます。
実行中に気付いたのですが、描画速度の最速は0.05s程度でした。
これよりタイマーの間隔を短くしても実行速度に変化がなかったので注意が必要です。
参考サイト
公式
wx.lib.plot — wxPython Phoenix 4.1.1a1 documentation
リアルタイム描画の参考
wxPython:アニメーションとグラフ描画を同時描画する
時間軸の参考
【備忘録】プロットの y 軸の目盛をカスタマイズ ─ wxPython
wxPython-users - wx.lib.plot custom labels?