はじめに
カラーマップの色を調べていた時にcolorcetというライブラリを見つけたので紹介します。
colorcetは均一な色のカラーバーを作成してくれるライブラリです。
環境
Mac OS
Python 3.9.1
colorcet 2.0.6
matplotlib 3.3.3
numpy 1.19.2
pip install colorcet matplotlib numpy
colorcet
以下のサイトから引用します。
colorcet 1.0.0 documentation
Background
Apart from the four uniform colormaps now provided with matplotlib, most continuous colormaps shipping with Python plotting programs are highly perceptually nonuniform. That is, small changes in data values result in large changes in the perceptual appearance of the corresponding colors, or vice versa. For instance, the popular matplotlib "hot" and "jet" colormaps have long stretches where the apparent colors change imperceptibly, such as the yellow region in "hot" and the cyan/green region in "jet":
When colormaps are used for visualizing scientific datasets, these perceptual nonlinearities can make interpretation of this data very difficult, because false boundaries appear in the data, and genuine boundaries and changes can be obscured.
大体の訳
- matplotlibのカラーマップは色の範囲が見た目的に不均一だよ
- 可視化の時に不均一なカラーマップを使用するとデータの解釈が困難になるよ
1行目がmatplotlibのカラーマップ(jet, hot)
2行目がjet, hotに対応したcolorcetのカラーマップ

matplotlibのカラーバーに赤線が引かれてある個所は、パッと見た時に色の違いがあまりわかりません。
その為この範囲のデータの解釈が難しくなってしまいます。
この問題を解決するのがcolorcetです。
以下にサンプルのカラーパレットがあります。
colorcet/named.png at master · holoviz/colorcet · GitHub
※ 翻訳間違えていたら申し訳ありません
詳細
colorcet.***, colorcet.b_***は16進数のリスト
colorcet.m_***はmatplotlibのLinearSegmentedColormap
で取得できます
リストで受け取る
import colorcet as cc

rainbow = cc.rainbow
# >>> ['#0034f8', '#0037f6', ..., '#ff2d00', '#ff2a00']
rainbow_l = len(rainbow)
# >>> 256
colorcet.palateから文字列を使用して取得することもできます
rainbow = cc.palette['rainbow']
その他パレット例
# その他

# blue, green, yellow, red
b_rain = cc.b_rainbow_bgyr_35_85_c72
# blue, green, yellow, red, magenta
b_rain2 = cc.b_rainbow_bgyrm_35_85_c71

fire = cc.fire
LinearSegmentedColormapで受け取る
import colorcet as cc

rainbow = cc.m_rainbow_bgyr_35_85_c73
print(rainbow.N)
# >>> 256
print(type(rainbow))
# >>> <class 'matplotlib.colors.LinearSegmentedColormap'>
colorcet.cmから文字列で取得することもできます
r = cc.cm['rainbow_bgyr_35_85_c73']
その他パレット例
# blue, green, yellow, red
m_rain = cc.m_rainbow_bgyr_35_85_c72
# blue, green, yellow, red, magenta
m_rain2 = cc.m_rainbow_bgyrm_35_85_c71

fire = cc.m_fire
# reverse
fire_r = cc.m_fire_r
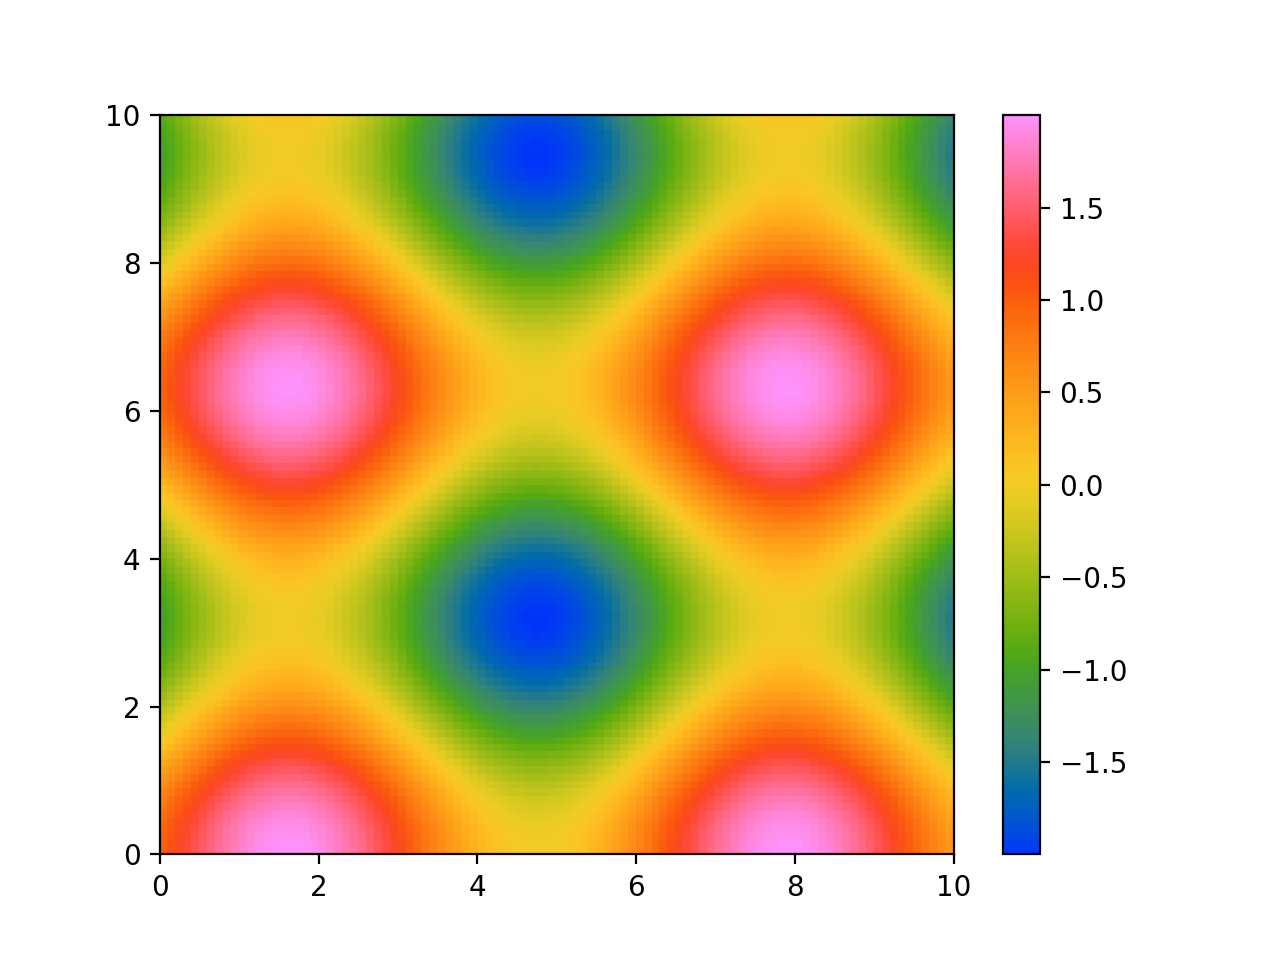
使用例
matplotlib
import colorcet as cc
import numpy as np
import matplotlib.pyplot as plt

X, Y = np.linspace(0, 10, 101), np.linspace(0, 10, 101)
XX, YY = np.meshgrid(X, Y)
Z = np.sin(XX) + np.cos(YY)

fig, ax = plt.subplots()

cmap = cc.m_rainbow_bgyrm_35_85_c71

colormap = ax.pcolormesh(XX, YY, Z, cmap=cmap)
fig.colorbar(colormap)

plt.show()

pyqtgraph
自分がよく使うのでついでに
pip install PyQt5 pyqtgraph pgcolorbar
import colorcet as cc
import numpy as np
from PyQt5 import QtWidgets
from pgcolorbar.colorlegend import ColorLegendItem
import pyqtgraph as pg


def make_lookup_table_b() -> np.ndarray:
    """colorcet.b_***を使用してlookup table作成"""

    def hex_to_rgb(hex_: str) -> list:
        h = hex_.lstrip('#')
        return [int(h[i:i + 2], 16) for i in (0, 2, 4)]

    cmap = cc.b_rainbow_bgyrm_35_85_c71

    rgb = list(map(hex_to_rgb, cmap))
    lookup_table = np.array(rgb, dtype=np.uint8)
    return lookup_table


def make_lookup_table_m() -> np.ndarray:
    """colorcet.m_***を使用してlookup table作成"""

    cmap = cc.m_rainbow_bgyrm_35_85_c71

    rgb = np.array([cmap(i)[:-1] for i in range(cmap.N)]) * 255
    lookup_table = rgb.astype(np.uint8)
    return lookup_table


class Colormap(QtWidgets.QGraphicsWidget):
    def __init__(self, *args, **kwargs) -> None:
        super(Colormap, self).__init__(*args, **kwargs)

        self.image = pg.ImageItem(axisOrder='row-major')
        self.image.setLookupTable(make_lookup_table_b())

        self.view_box = pg.ViewBox(lockAspect=True)
        self.view_box.addItem(self.image)

        self.plot = pg.PlotItem(viewBox=self.view_box)

        self.color_bar = ColorLegendItem(imageItem=self.image)

        self.layout = QtWidgets.QGraphicsGridLayout()
        self.layout.setContentsMargins(1, 1, 1, 1)
        self.layout.setSpacing(0)
        self.layout.addItem(self.plot, 0, 0)
        self.layout.addItem(self.color_bar, 0, 1)
        self.setLayout(self.layout)


if __name__ == '__main__':
    import sys

    X, Y = np.linspace(0, 10, 101), np.linspace(0, 10, 101)
    XX, YY = np.meshgrid(X, Y)
    Z = np.sin(XX) + np.cos(YY)

    app = QtWidgets.QApplication(sys.argv)

    colormap = Colormap()
    colormap.image.setImage(Z)
    colormap.color_bar.resetColorLevels()

    window = pg.GraphicsLayoutWidget()
    window.addItem(colormap)
    window.show()

    sys.exit(app.exec_())

参考
colorcet 1.0.0 documentation
GitHub - holoviz/colorcet: A set of useful perceptually uniform colormaps for plotting scientific data