データをビンに分けてヒストグラム等を描画する処理自体は、matplotlibの hist() に array を渡せばデータに応じて良い感じのビンに切り分けて描画してくれますが、任意のビンでデータを分けたい場合や、どのデータがどのビンに入っているか知りたい場合があります。
今回は、ビンの作成および、データとビンの対応関係を取得を行います。
分布の作成
まず適当な分布の array を作成します。
import numpy

n = 100
dist = numpy.random.normal(0, 1, n)
ビンの作成
ビンの数の妥当性に関しては議論があるようですが、Microsoft Excel 等では標準でデータ数 n に対してビンの数 k を n の平方数とするみたいです。
k=\sqrt{n}
今回はこの方法でビンの数を決めて、データの範囲を k 分割する array をビンとして作成します。
import math

bin_num = math.sqrt(n)
bins = numpy.linspace(min(dist), max(dist), bin_num)
次のような array が作成されました。
[-2.28875045 -1.72785426 -1.16695807 -0.60606188 -0.0451657 0.51573049 1.07662668 1.63752287 2.19841906 2.75931524]
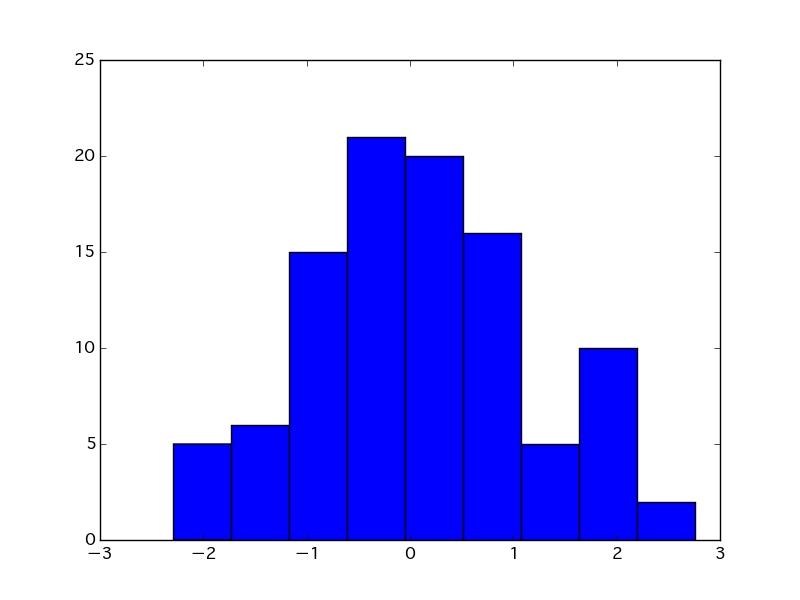
確認
作成したビンを使ってデータがどのようにプロットされるか確認してみます。
import matplotlib.pyplot as plt

plt.hist(dist, bins=bins)
plt.show()
データとビンの対応の取得
numpy.digitize() でデータに対応したビンの位置情報が格納されたリストを取得できます。
bin_indice = numpy.digitize(dist, bins)
以下の結果の場合は、dist[0] は4番目のビン、dist[1]は5番目のビンに対応するという感じです。
[ 4 5 8 6 4 6 8 1 6 6 8 2 6 3 5 4 5 4 5 3 8 2 5 5 4 4 4 4 2 3 5 6 5 3 4 3 7 6 4 3 4 4 8 2 4 4 8 6 6 3 6 2 9 5 5 4 4 1 8 6 5 5 5 5 4 1 10 3 1 8 7 3 4 3 8 2 6 5 6 3 6 7 5 3 3 5 5 5 4 1 3 6 5 6 7 3 4 7 8 4]
zip() でくっつけてみます。
bin_data_map = zip(dist, bin_indice)
[(-0.16840296791127732, 4), (0.43715458127052381, 5), (1.8635306330264274, 8), (0.89273121368100206, 6),...