世はまさに大クラウド時代ですが、その中でも3大クラウドと言われるAWS、Azure、GCPのQiitaでの現状について調べてみました。まず歴史から辿るとそれぞれのサービス開始時期は以下の通りです。
AWS:2006年
Azure:2010年
GCP:2008年(GAEの開始年)
AWSのサービス開始から約15年経ち、2020年時点でのシェアはCanalys報告書によると、AWS、Azure、GCPの順に32%、20%、7%となっています。Stack Overflow Developer Survey 2020の最も好きなプラットフォームの項目でも、AWSが一番人気ですが他2つも高い人気となっています。日本ではAWSが圧倒的に広まっている印象で上記海外の調査は少し意外だったため、Qiitaでの現状を調べてみました。
調査結果
今回は簡易的に「AWS」「Azure」「gcp」のタグがついた記事が各年で何件あるか調査しました。結果が以下です。
| 2010 | 2011 | 2012 | 2013 | 2014 | 2015 | 2016 | 2017 | 2018 | 2019 | 2020 | |
|---|---|---|---|---|---|---|---|---|---|---|---|
| AWS | 0 | 1 | 42 | 203 | 798 | 1599 | 2265 | 2415 | 3510 | 5114 | 6664 |
| Azure | 0 | 0 | 3 | 7 | 59 | 148 | 337 | 575 | 743 | 946 | 1362 |
| gcp | 0 | 0 | 0 | 0 | 6 | 21 | 89 | 222 | 575 | 955 | 1111 |
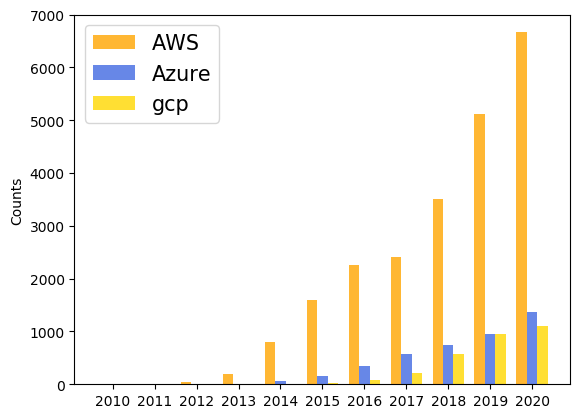
この結果だけで判断するのは安直ですが、日本ではAWSのシェアが群を抜いていそうです。日本語の情報が圧倒的に多いことでAWSの使用が加速しているのではないでしょうか。今後の展開が楽しみです。
調査に使用したプログラム
qiita_cloud_count.py
from bs4 import BeautifulSoup
import matplotlib.pyplot as plt
import numpy as np
import requests
import time

# Qiitaで投稿日、タグを指定して検索し、ヒットした記事数を取得する
base_url = 'https://qiita.com/search'

tags = ['AWS', 'Azure', 'gcp']
years = range(2010, 2021)

summary = []
for tag in tags:
    temp = []
    for year in years:
        params = f'?q=tag%3A{tag}+created%3A%3E%3D{year}-01-01+created%3A%3C{year}-12-31'
        html_doc = requests.get(base_url + params)
        data = BeautifulSoup(html_doc.text, 'html.parser')
        temp.append(int(data.find('span', class_='badge').text))
        time.sleep(5) # サーバ負荷軽減用
    summary.append(temp)

data = np.array(summary)
print(data)


# 以下グラフ描画用
num_tags = data.shape[0]
num_years = data.shape[1]
index = np.arange(num_years)
fig, ax = plt.subplots()
bar_width = 0.25
alpha = 0.8
colors = ["orange", "royalblue", "gold"]

for i in range(num_tags):
	plt.bar(
		index + bar_width*i,
		data[i],
		bar_width,
        alpha=alpha,
		color=colors[i],
		label=tags[i]
		)

plt.ylabel('Counts')
plt.xticks(index + bar_width, years)
plt.legend(prop={'size' : 15},loc="upper left")
plt.savefig("cloud_cnt.png", bbox_inches = 'tight')