はじめに
最近EclipseにXdebugの導入を行ったため、導入手順を備忘録として残します。
開発環境
・windows10 pro
・XAMPP(php 7.4, Xdebug 3.1.6)
・Eclipse
予めXAMPP,Eclipseの導入が済んでいる前提で話を進めていきます。
Xdebugの導入
①Xdebugのインストール
まずはXdebugのインストールが必要になります。
公式サイトからXdebugをインストールします。
ただしバージョンが複数あり、それぞれの環境によって選ぶバージョンが異なるため、下記のURLのサイトを使用します。
URL: https://xdebug.org/wizard
このサイトでは現在の自分の環境にあったバージョンを自動で選定してくれます。
それではまずXAMPPのダッシュボードに移動し、右上の「PHPinfo」をクリックします。
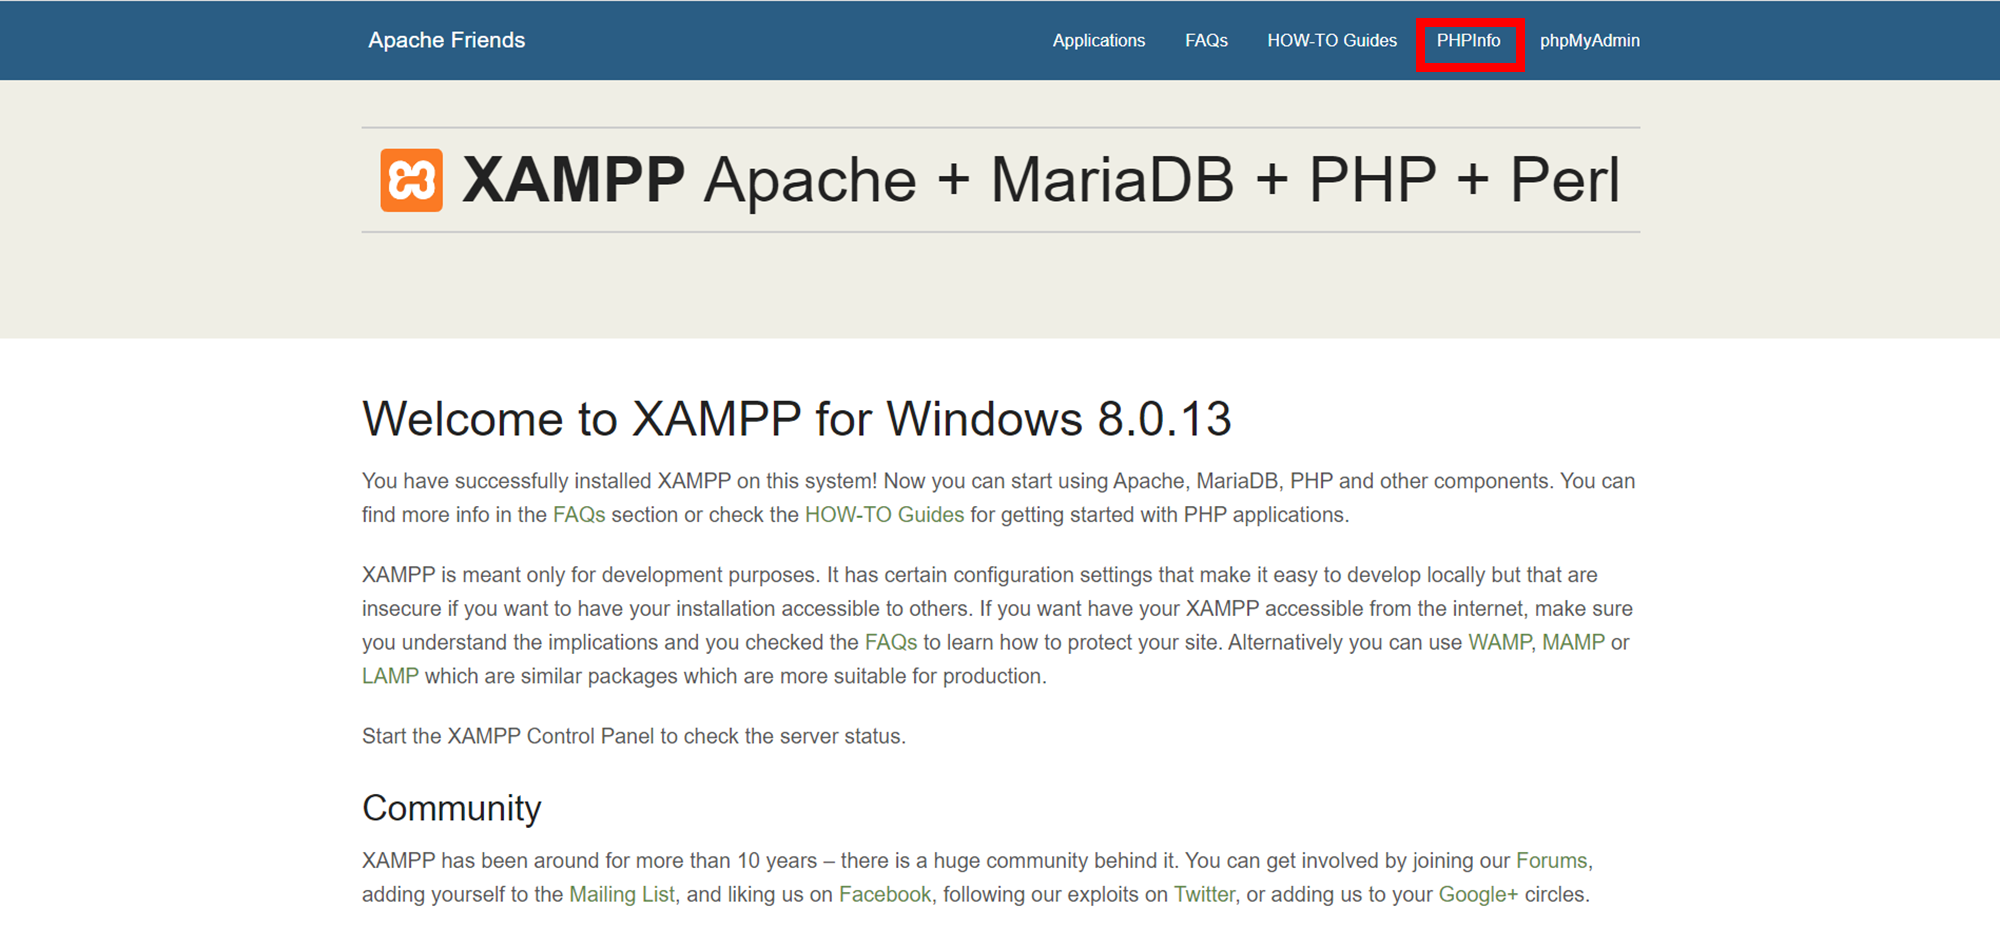
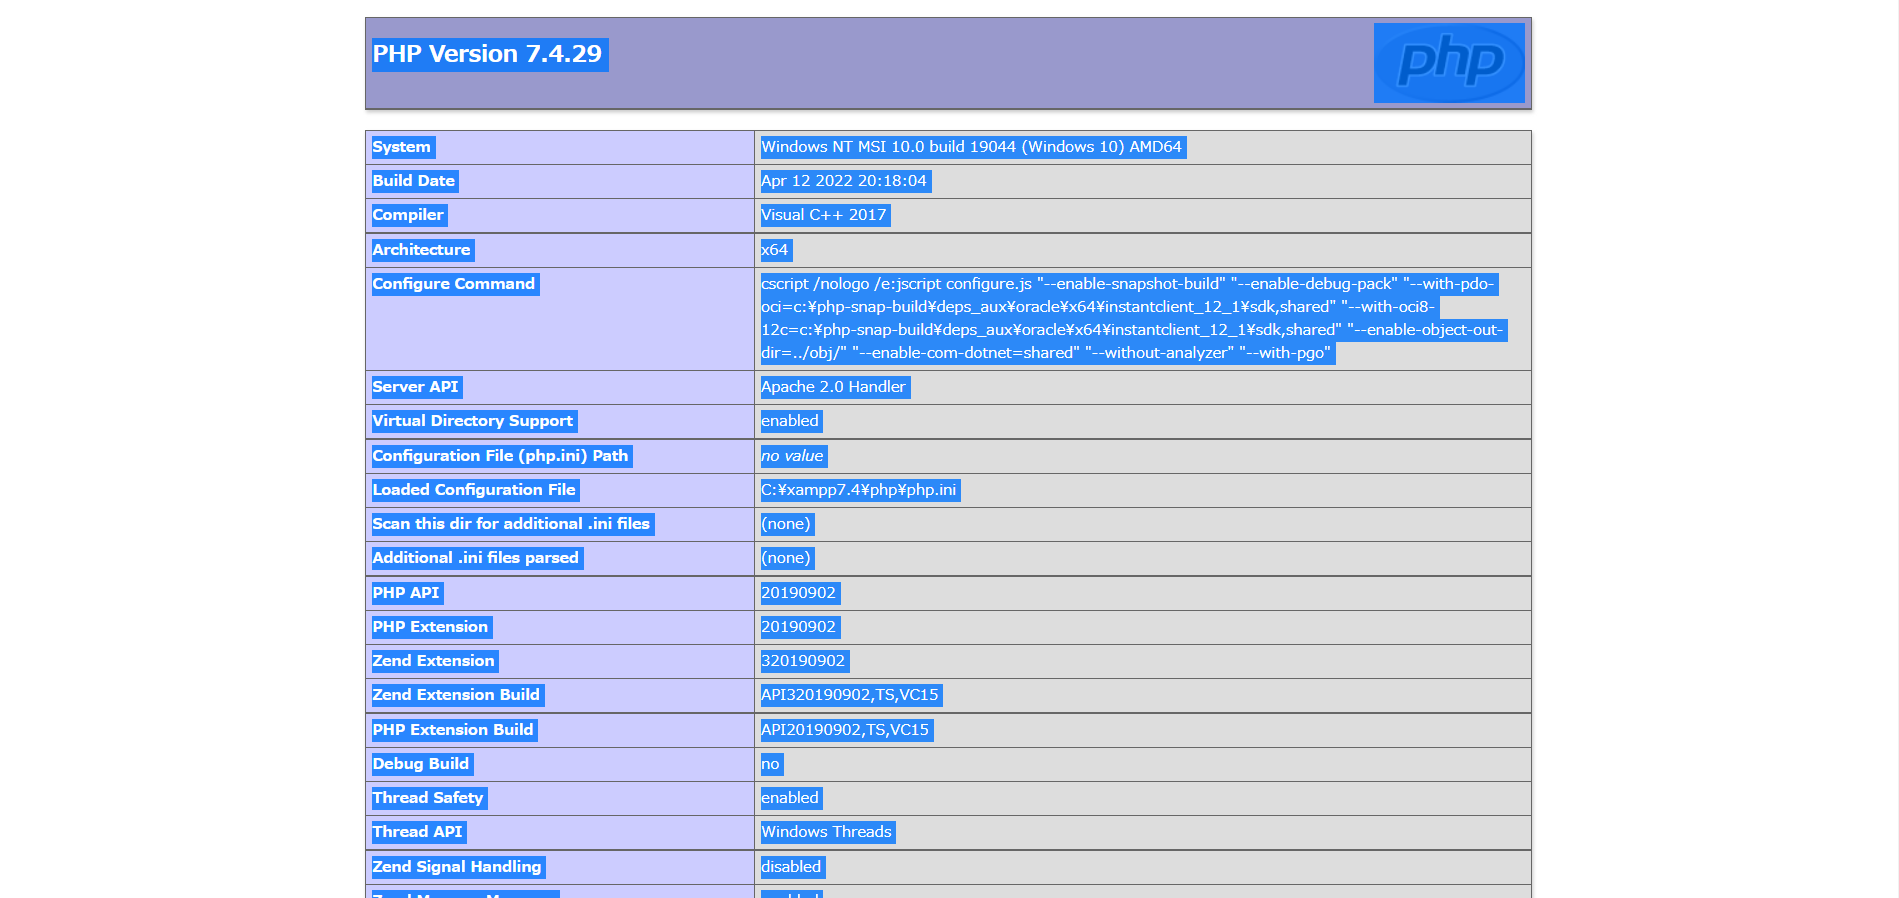
するとこのような画面が出てくるので、「ctrl」+「a」で全選択し、コピーします。
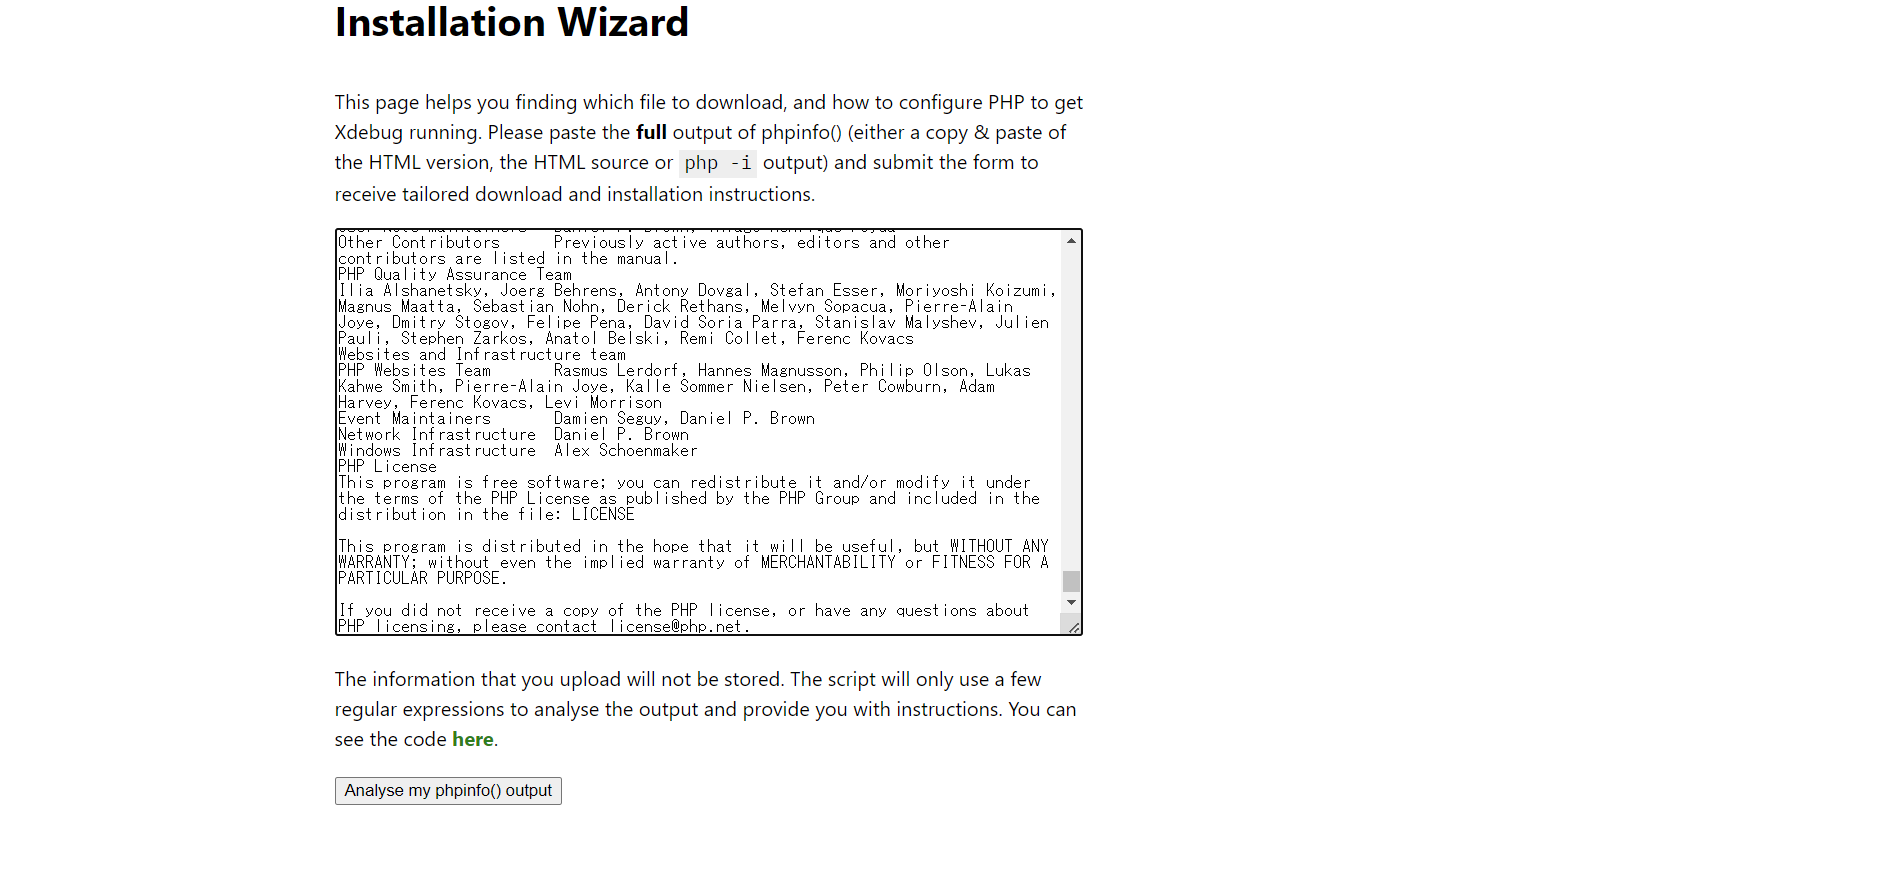
そしたら、Installation Wizardに移動し、テキストボックスに先ほどコピーしたものをペーストします。
ペースト後、下の「Analyse my phpinfo() output」を押します。
赤く囲んだ部分にダウンロードリンクがあるので、ダウンロードします。
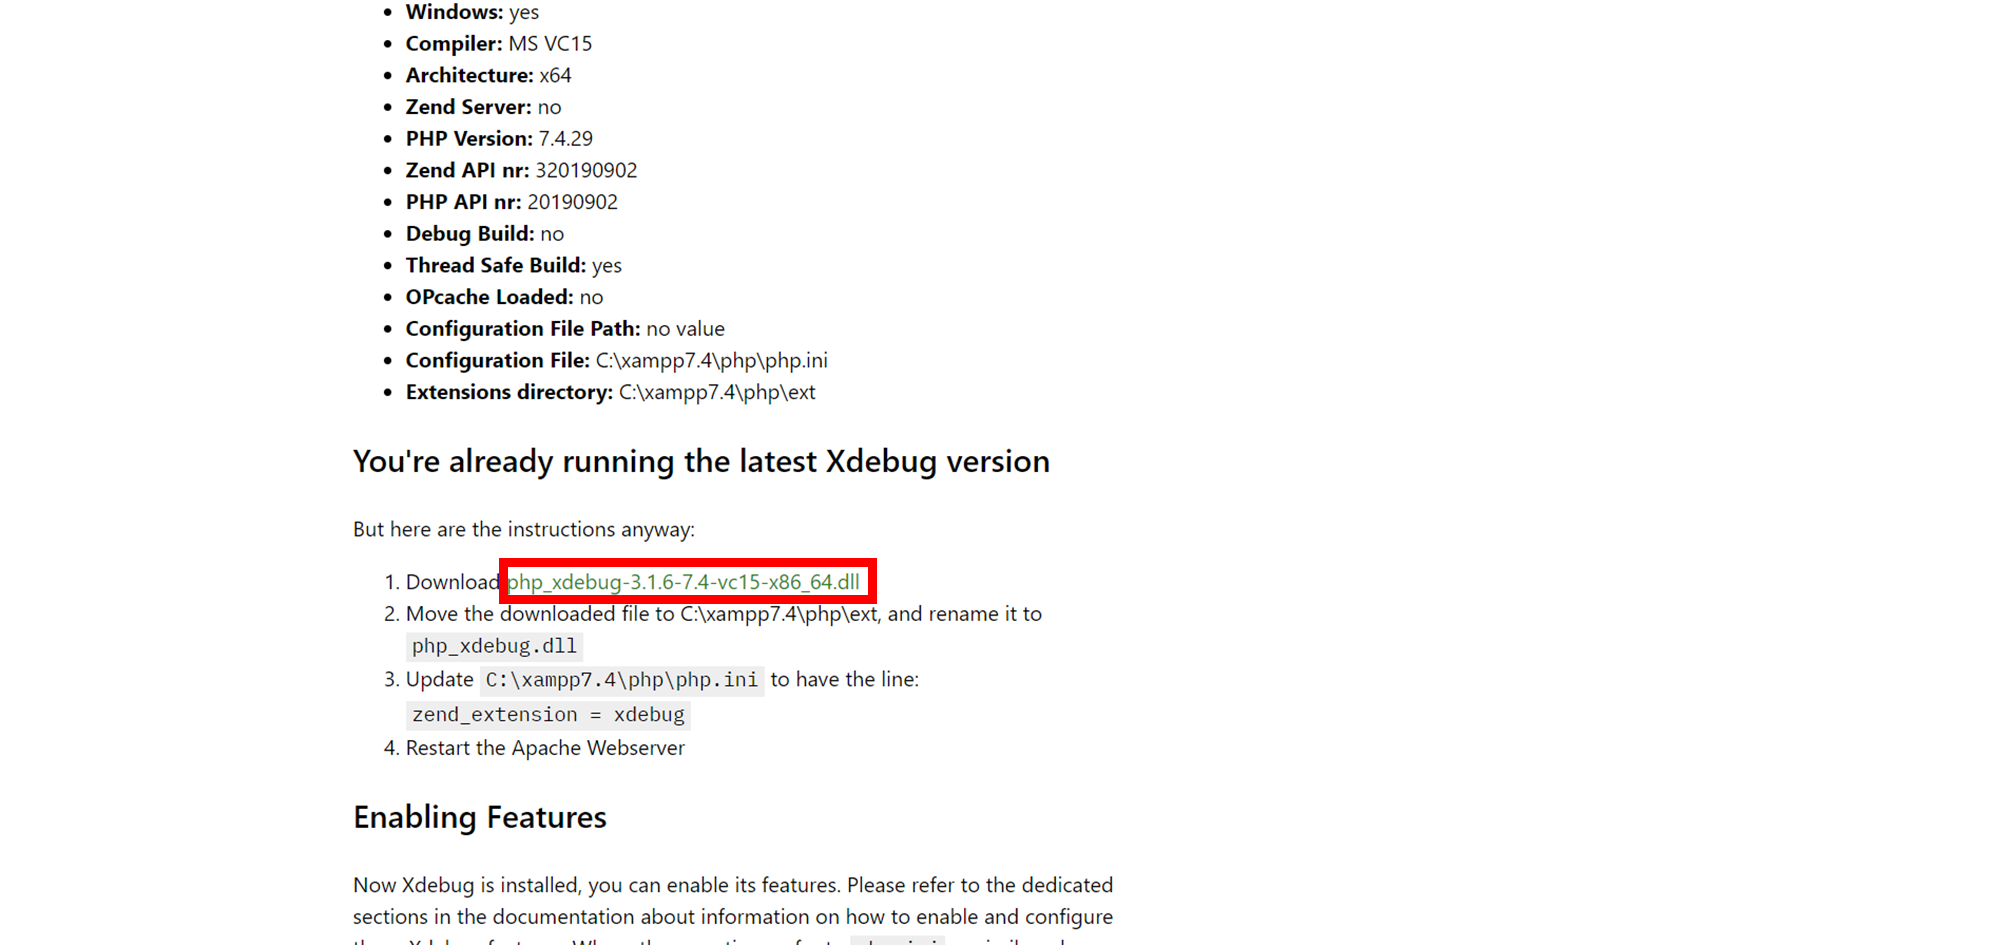
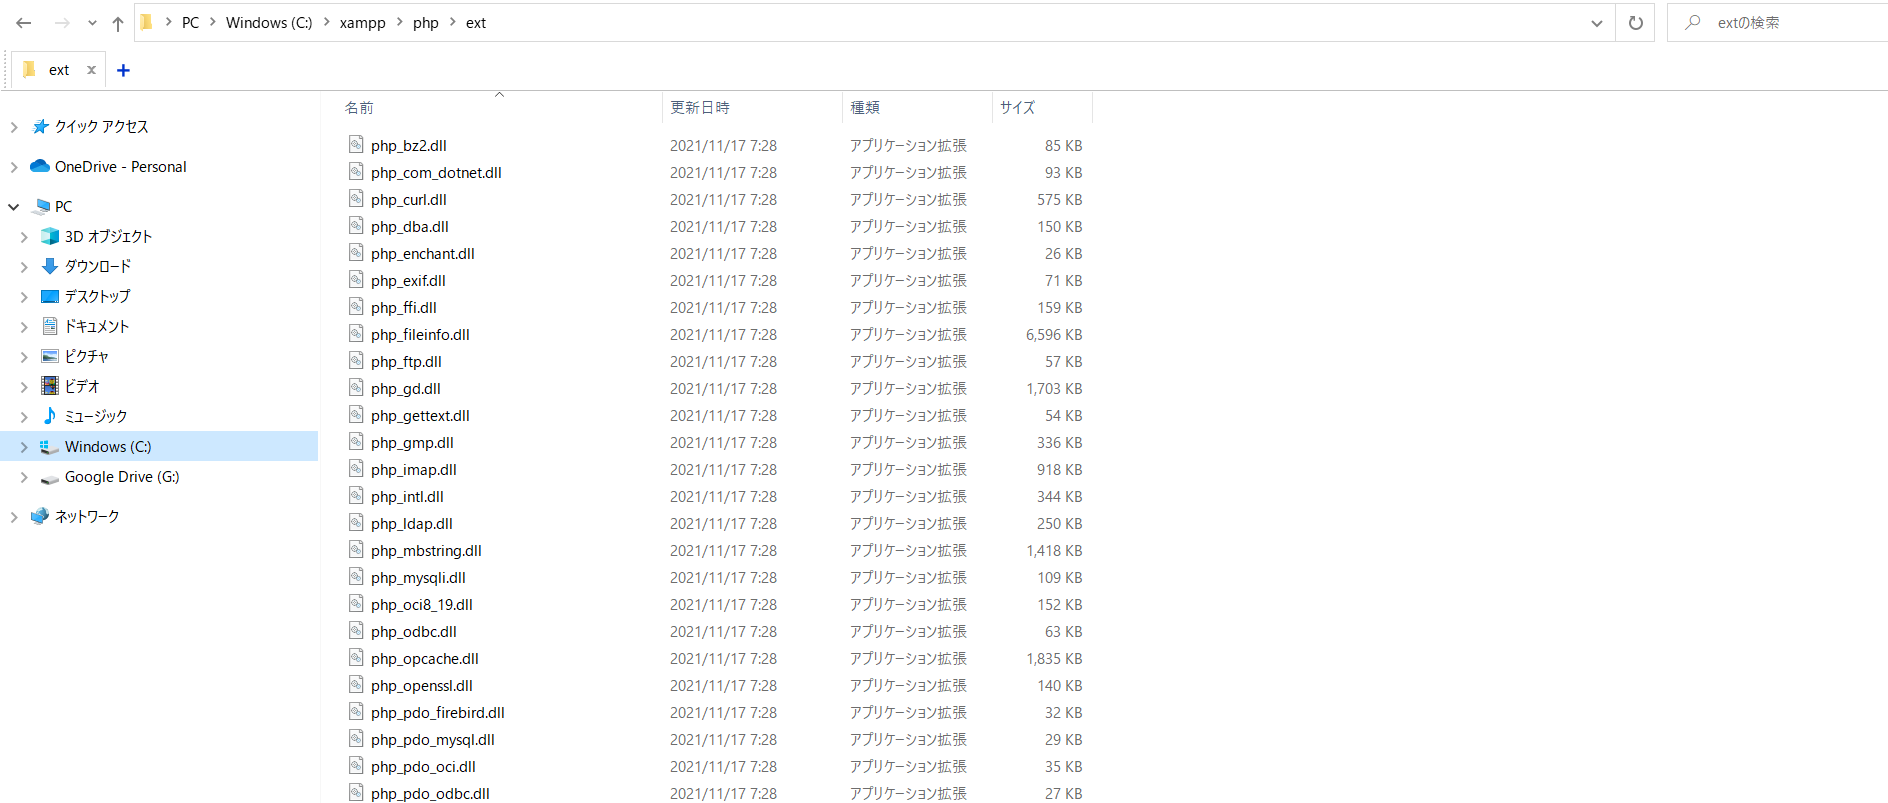
ダウンロード後、「\xampp\php\ect」のフォルダに移動させます。
②XAMPPの「php.ini」を編集する。
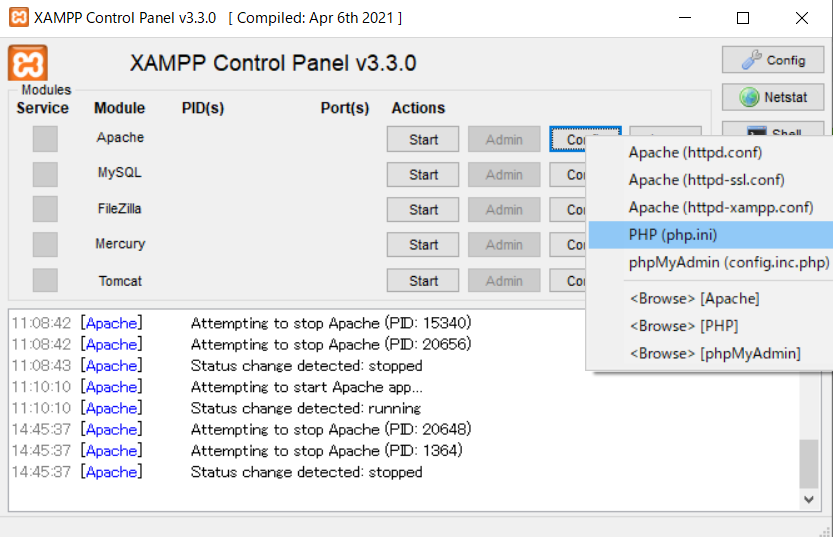
「php.ini」を選択し、行の一番最後に下記のコードを入力する。
ここで先ほどダウンロードしたXdebugのバージョンによって書き方が違うため、それぞれのバージョンにあわせて選択して入力してください。
[XDebug 2.x]
zend_extension = "C:\xampp\php\ext\php_xdebug.dll"
xdebug.profiler_append = 0
xdebug.profiler_enable = 0
xdebug.profiler_enable_trigger = 0
xdebug.profiler_output_dir = "C:\xampp\tmp"
xdebug.profiler_output_name = "cachegrind.out.%t-%s"
xdebug.remote_enable = 1
xdebug.remote_port = "9000"
xdebug.remote_handler = "dbgp"
xdebug.remote_host = "127.0.0.1"
xdebug.remote_mode = "req"
xdebug.trace_output_dir = "C:\xampp\tmp"
[XDebug 3.x]
zend_extension = "C:\xampp\php\ext\php_xdebug.dll"
xdebug.profiler_append = 0
xdebug.profiler_enable = 0
xdebug.profiler_enable_trigger = 0
xdebug.profiler_output_dir = "C:\xampp\tmp"
xdebug.profiler_output_name = "cachegrind.out.%t-%s"
xdebug.mode = debug
xdebug.start_with_request = yes
xdebug.client_port = 9003
xdebug.remote_handler = "dbgp"
xdebug.client_host = "127.0.0.1"
xdebug.remote_mode = "req"
xdebug.trace_output_dir = "C:\xampp\tmp"
「zend_extension」の部分は、先ほどダウンロードして移動させたファイルのパスを指定してください。
③ EclipseでXdebugの設定をする。
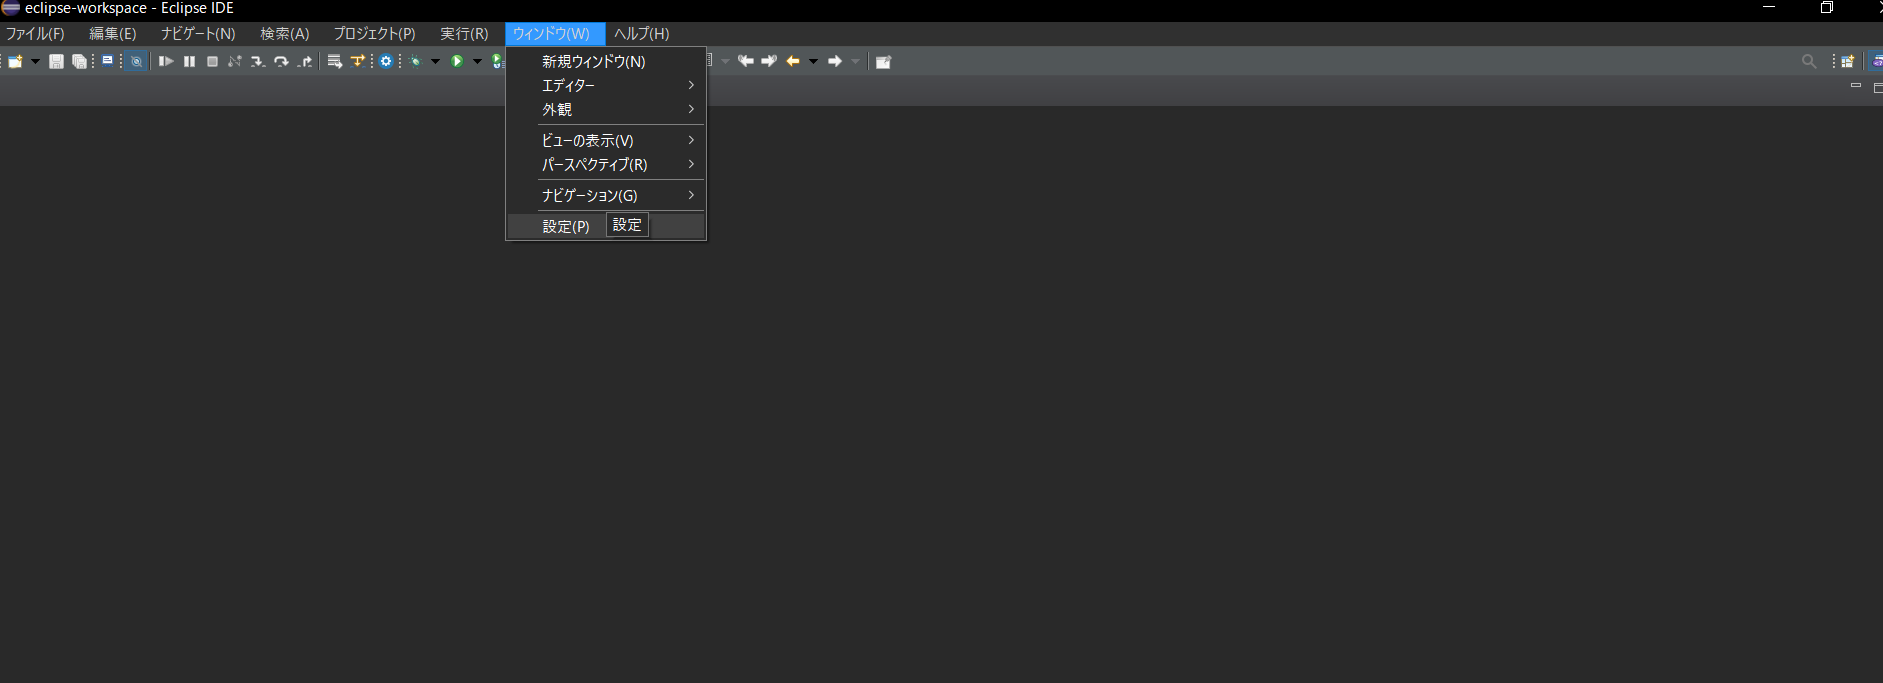
「ウィンドウ」タブの「設定」をクリック
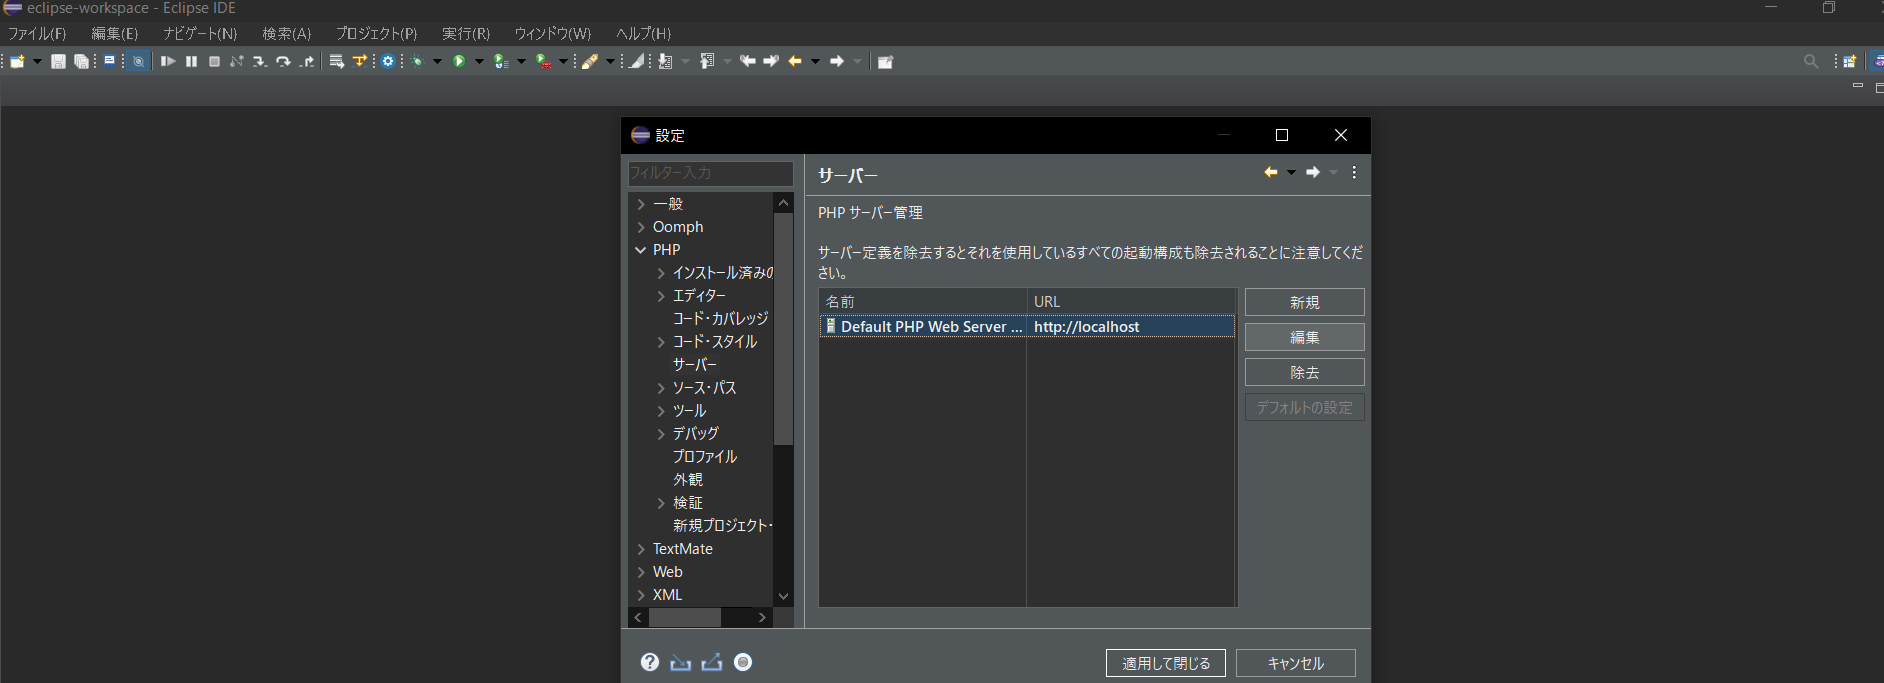
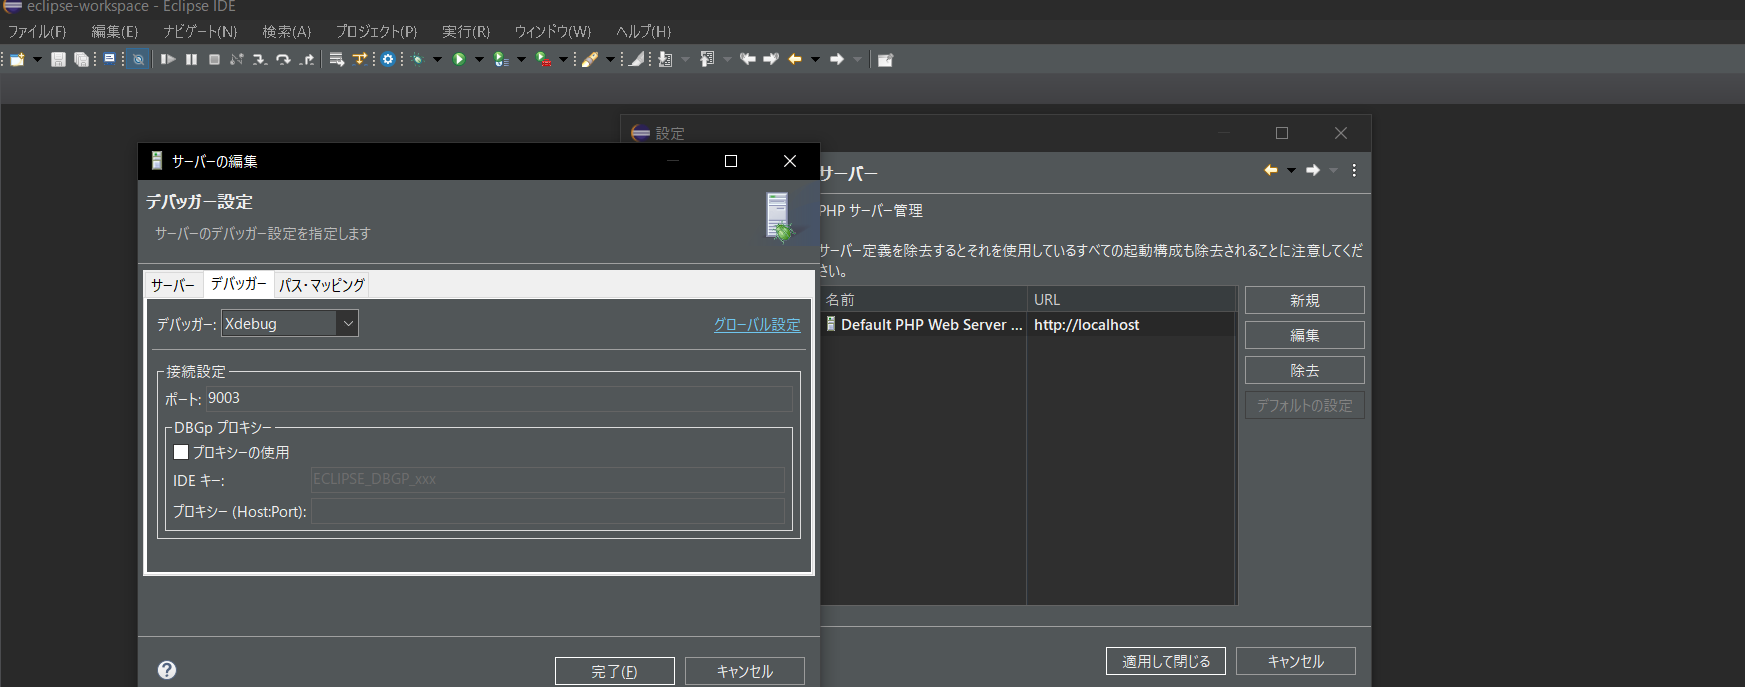
PHPのサーバーから該当のものを選択し、「編集」を押す。
「デバッガー」タブでデバッガーで「Xdebug」を選択し、ポート番号は先ほどphp.iniに記載した「xdebug.remote_port」と同じ番号を入力する。
設定出来たら、「完了」を押す。
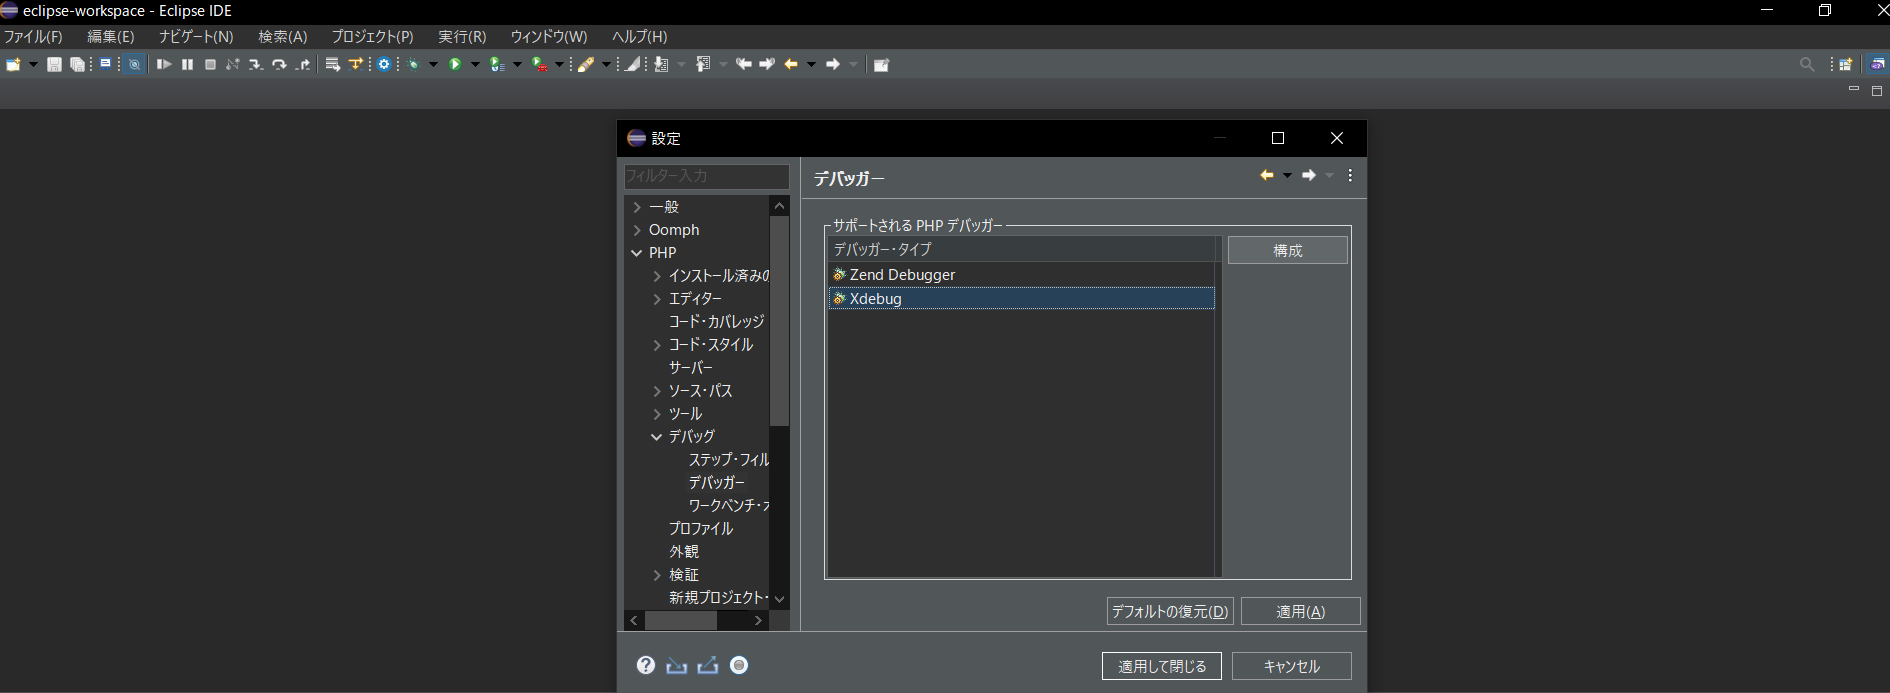
また「デバッグ」のデバッガーから「Xdebug」を選択し、「構成」を押す。
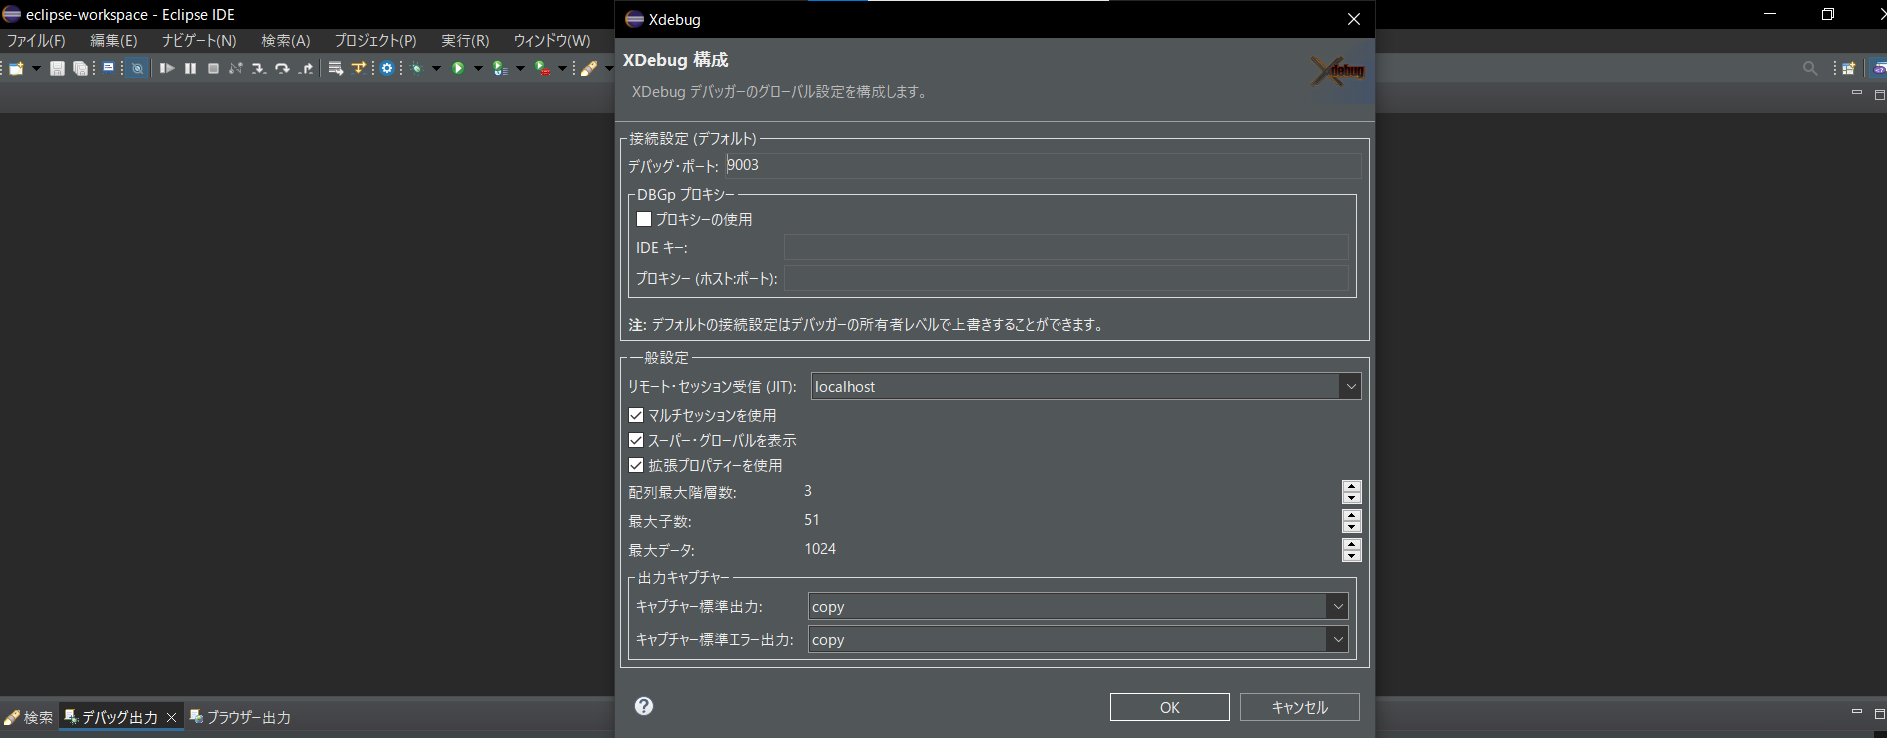
ここのポート番号も先ほどと同じ値を入力する。
入力出来たら、「OK」を押し、「適用をして閉じる」を押す。
これであとはブレーキングポイントを作り、実行すれば無事にデバッグが働くはずです!
参考サイト