概要
elasticsearch + kibana + fluentdを使用してログを可視化してみます。今回は、nginxのレスポンスを可視化して性能の見える化をしていきます。
パフォーマンスチューニングのためにも現状の性能を知ることは大切です。
今回はテストのため単一のホストにすべてインストールしますが、elasticsearchは基本的にクラスタを組むべきです。
nginx(ログ監視対象)
今回テストに使用するnginxをインストールします。
nginxインストール
apt update
apt install nginx
起動する
systemctl status nginx
systemctl start nginx
systemctl status nginx
アクセスしてログ出す
http://youradress
デフォルトのアクセスログはこんな感じのフォーマットです。
192.168.11.10 - - [09/Dec/2023:01:48:13 +0000] "GET /favicon.ico HTTP/1.1" 404 197 "http://192.168.11.16/" "Mozilla/5.0 (Macintosh; Intel Mac OS X 10_15_7) AppleWebKit/537.36 (KHTML, like Gecko) Chrome/118.0.0.0 Safari/537.36"
これだとレスポンスタイムが出てないので、設定ファイル修正してレスポンスタイムが出るようにします。以下のドキュメントでnginxのログフォーマットについて説明されています。
vi /etc/nginx/nginx.conf

### httpのセクションにlog_formatを追加する ###

http {
# ~~~
        log_format main '$remote_addr - $remote_user [$time_local] '
                       '"$request" $status $bytes_sent '
                       '"$http_referer" "$http_user_agent" $gzip_ratio $request_length $request_time';
        access_log /var/log/nginx/access.log main;
# ~~~
}
nginx再起動
systemctl restart nginx
アクセスログを再確認してみましょう
192.168.11.10 - - [09/Dec/2023:07:43:05 +0000] "GET /favicon.ico HTTP/1.1" 404 392 "http://192.168.11.16/" "Mozilla/5.0 (Macintosh; Intel Mac OS X 10_15_7) AppleWebKit/537.36 (KHTML, like Gecko) Chrome/118.0.0.0 Safari/537.36" 3.03 904 0.000
最後の方にレスポンスタイムが記載されていると思います。
Elasticsearch
次に全文検索エンジンのelasticsearchをインストールします。
Elasticsearch PGP キーをインポートする
wget -qO - https://artifacts.elastic.co/GPG-KEY-elasticsearch | sudo gpg --dearmor -o /usr/share/keyrings/elasticsearch-keyring.gpg
apt-transport-httpsインストール
apt install apt-transport-https
リポジトリ定義を保存
echo "deb [signed-by=/usr/share/keyrings/elasticsearch-keyring.gpg] https://artifacts.elastic.co/packages/8.x/apt stable main" | sudo tee /etc/apt/sources.list.d/elastic-8.x.list
elasticsearchのインストール
apt install elasticsearch
メモリ一応制限1Gに押さえておきます。そんなにでかい環境ではないので・・・
vi /etc/elasticsearch/jvm.options

- -Xms2g
- -Xmx2g
+ -Xms1g
+ -Xmx1g
http許可したいので、以下設定修正(起動する前に設定ファイルを修正しておく)
vi /etc/elasticsearch/elasticsearch.yml


path.data: /var/lib/elasticsearch
path.logs: /var/log/elasticsearch
discovery.type: single-node
xpack.security.enabled: false
xpack.security.transport.ssl.enabled: false
xpack.security.http.ssl.enabled: false
警告
今回LAN内だけの利用なので、httpで接続するようにしています。外部との通信が発生する場合はhttpsを使用してください。
elasticsearchの起動
systemctl status elasticsearch
systemctl enable elasticsearch
systemctl restart elasticsearch
systemctl status elasticsearch
elasticユーザのパスワード自動生成(これいらないかも)
/usr/share/elasticsearch/bin/elasticsearch-reset-password -a -u elastic
※自分で作成する場合は、-iを指定
kibana
次にkibanaをインストールします。
kibanaのインストール
apt install kibana
起動する
systemctl status kibana
systemctl enable kibana
systemctl restart kibana
systemctl status kibana
kibanaに外部からの接続を許可する。ここで、LAN内からの接続のみとか設定できると思います。(今回はどこからでも接続OKにしちゃいます。)
vi /etc/kibana/kibana.yml

+ server.host: "0.0.0.0"
+ i18n.locale: "ja-JP"
アクセスしてみる
http://youradress:5601
※youradressには、kibanaインストールしたサーバのIPでいけます。
登録用のトークン取得
/usr/share/elasticsearch/bin/elasticsearch-create-enrollment-token -s kibana --url https://youradress:9200
検証コード取得
/usr/share/kibana/bin/kibana-verification-code
fluentd
最後にログ収集のエージェントとしてfluentdを入れます。
fluentdインストール
curl -fsSL https://toolbelt.treasuredata.com/sh/install-ubuntu-jammy-fluent-package5-lts.sh | sh
fluentdの実行ユーザをrootに変更しておきます。(ほんとはちゃんと権限管理するべきですが、面倒なのでrootで実行にしちゃいます。)
vi /lib/systemd/system/fluentd.service

[Service]
User=root
Group=root
unitファイル修正したので、daemon-reloadする
systemctl daemon-reload
fluentdの設定変更します。sourceで入力するログの情報を記載します。今回は、nginxのアクセスログです。matchでは、elasticsearchに送信するための設定が書いてあります。
# nginxログをinputする設定
<source>
  @type tail
  path /var/log/nginx/access.log
  format /^(?<remote>[^ ]*) (?<host>[^ ]*) (?<user>[^ ]*) \[(?<time>[^\]]*)\] "(?<method>\S+)(?: +(?<path>[^\"]*?)(?: +\S*)?)?" (?<code>[^ ]*) (?<size>[^ ]*)(?: "(?<referer>[^\"]*)" "(?<agent>[^\"]*)"(?:\s+(?<http_x_forwarded_for>[^ ]+))?) (?<request_length>[^ ]*) (?<request_time>[^ ]*)"?/
  time_format %d/%b/%Y:%H:%M:%S %z
  tag nginx.access
  pos_file /var/log/nginx/access.log.pos
</source>

# inputしたnginxログをelasticsearchに流し込む
<match nginx.access>
  @type elasticsearch

  logstash_format true
  logstash_prefix nginx-access
  logstash_dateformat  %Y-%m-%d

  host localhost
  port 9200

  type_name accesslog
</match>
fluentdの正規表現については、以下のサイトとかを参考にして作成してみてください。
https://fluentular.herokuapp.com/
https://docs.fluentd.org/parser/regexp
kibana画面からの操作
kibanaの画面でindex templateを設定します。nginx-access-yyyy-mm-ddにマッチするようにします。index templateを設定しておかないと、elasticsearchに適当な型を付けられてしまうので、設定しておきましょう。(可視化するときに型がtextだと無理とかあるので。)
http://youradress:5601/app/management/data/index_management/create_template
# Load JSON

{
  "properties": {
    "remote": {
      "type": "text"
    },
    "host": {
      "type": "text"
    },
    "user": {
      "type": "text"
    },
    "method": {
      "type": "text"
    },
    "path": {
      "type": "text"
    },
    "code": {
      "type": "integer"
    },
    "size": {
      "type": "integer"
    },
    "referer": {
      "type": "text"
    },
    "agent": {
      "type": "text"
    },
    "http_x_forwarded_for": {
      "type": "float"
    },
    "request_length": {
      "type": "integer"
    },
    "request_time": {
      "type": "float"
    }
  }
}
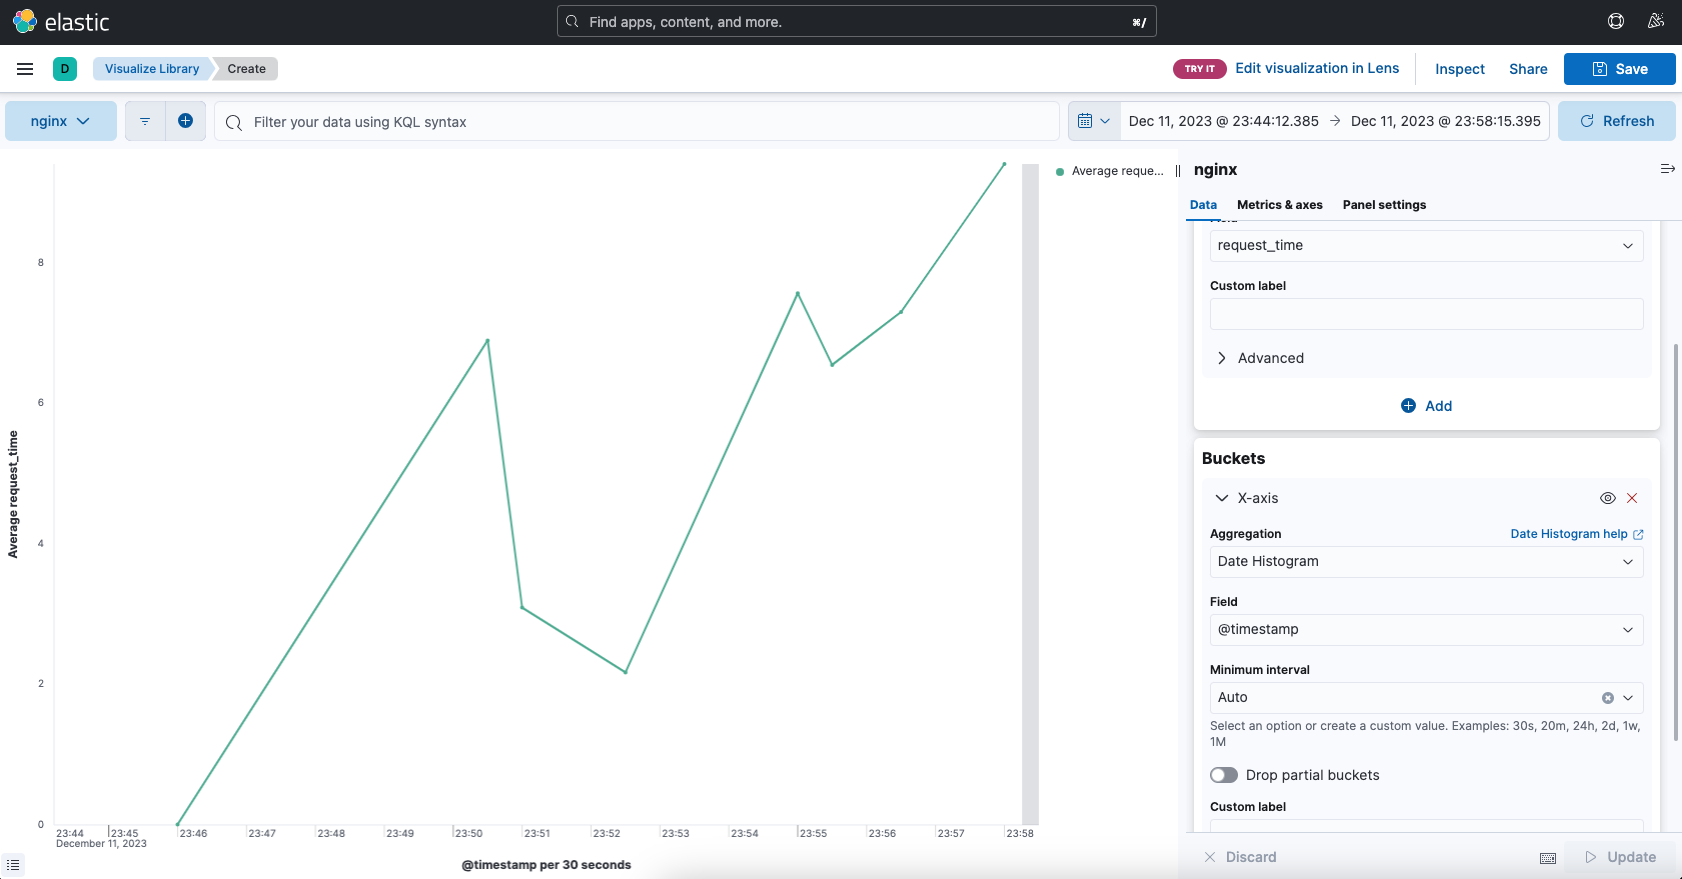
上記の設定が済むと、nignxのアクセスログがelasticsearchに流れ込むようになり、kibanaのvisualizeでログのレスポンスタイムを可視化することができます。