これは何か
時系列及び波形データを扱うことがあり、そこで幾つかのsmoothingを試した。備忘録程度に3手法をまとめて記しておく。
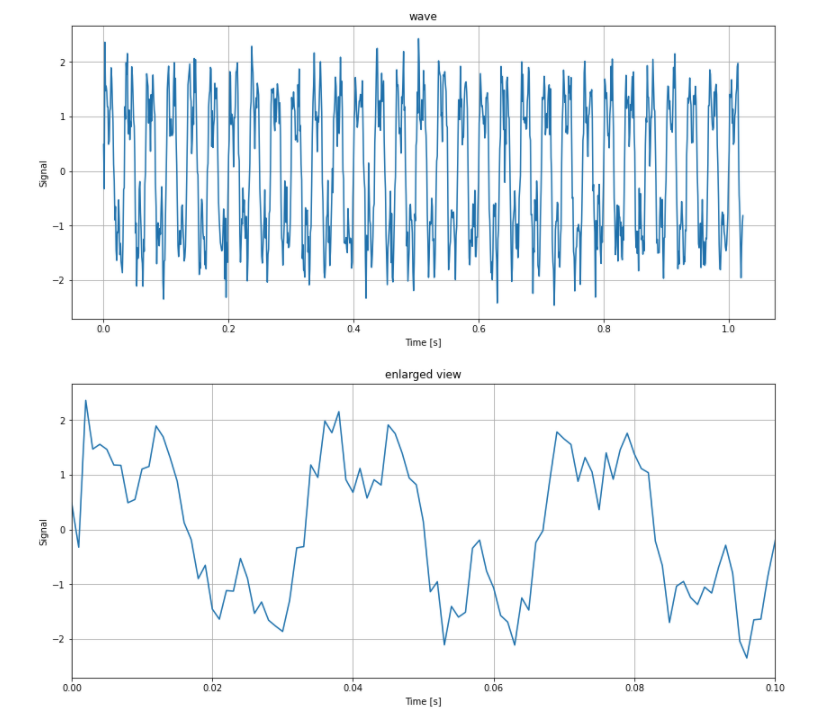
波形データの生成
今回使用する波形データを生成しておく
import numpy as np
import matplotlib.pyplot as plt


N = 1024            # サンプル数
dt = 0.001          # サンプリング周期 [s]
f1, f2 = 30, 90    # 周波数 [Hz]
a1, a2 = 1.5, 0.8 # 振幅

t = np.arange(0, N*dt, dt) # 時間 [s]
wave = a1*np.sin(2*np.pi*f1*t) + a2*np.sin(2*np.pi*f2*t) + 0.3 * np.random.randn(N) # 信号


fig, ax = plt.subplots(figsize=(14.0, 6.0))
ax.plot(t, wave)
ax.set_xlabel("Time [s]")
ax.set_ylabel("Signal")
ax.grid()
plt.title("wave")
plt.show()

fig, ax = plt.subplots(figsize=(14.0, 6.0))
ax.plot(t, wave)
ax.set_xlim(0, 0.1)
ax.set_xlabel("Time [s]")
ax.set_ylabel("Signal")
ax.grid()
plt.title("enlarged view")
plt.show()
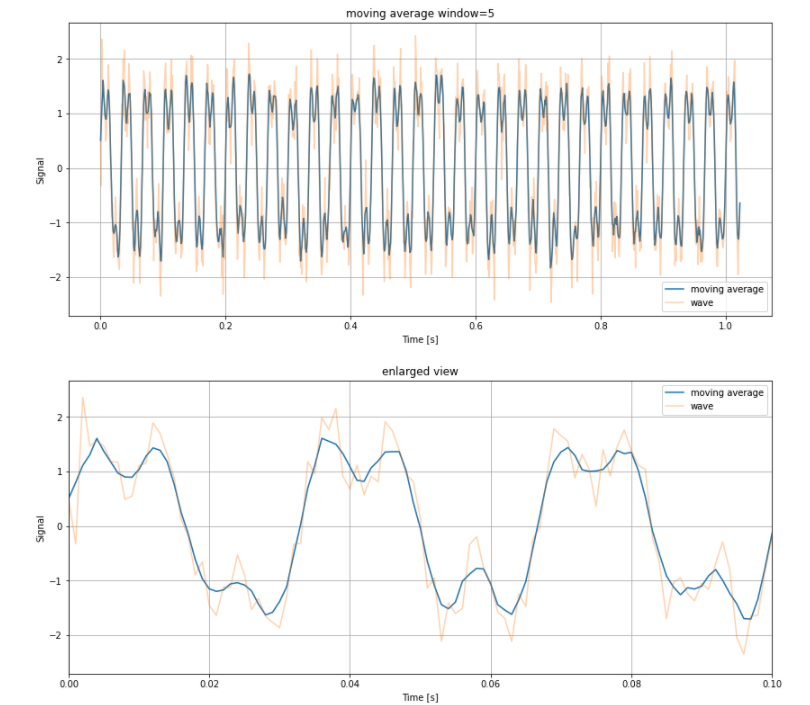
1. 移動平均
window = 5 # 移動平均の範囲
w = np.ones(window)/window

x = np.convolve(wave, w, mode='same')

fig, ax = plt.subplots(figsize=(14.0, 6.0))
ax.plot(t, x, label='moving average')
ax.plot(t, wave, alpha=0.3, label='wave')
ax.set_xlabel("Time [s]")
ax.set_ylabel("Signal")
ax.grid()
plt.legend()
plt.title("moving average window=5")
plt.show()

fig, ax = plt.subplots(figsize=(14.0, 6.0))
ax.plot(t, x, label='moving average')
ax.plot(t, wave, alpha=0.3, label='wave')
ax.set_xlim(0, 0.1)
ax.set_xlabel("Time [s]")
ax.set_ylabel("Signal")
ax.grid()
plt.legend()
plt.title("enlarged view")
plt.show()
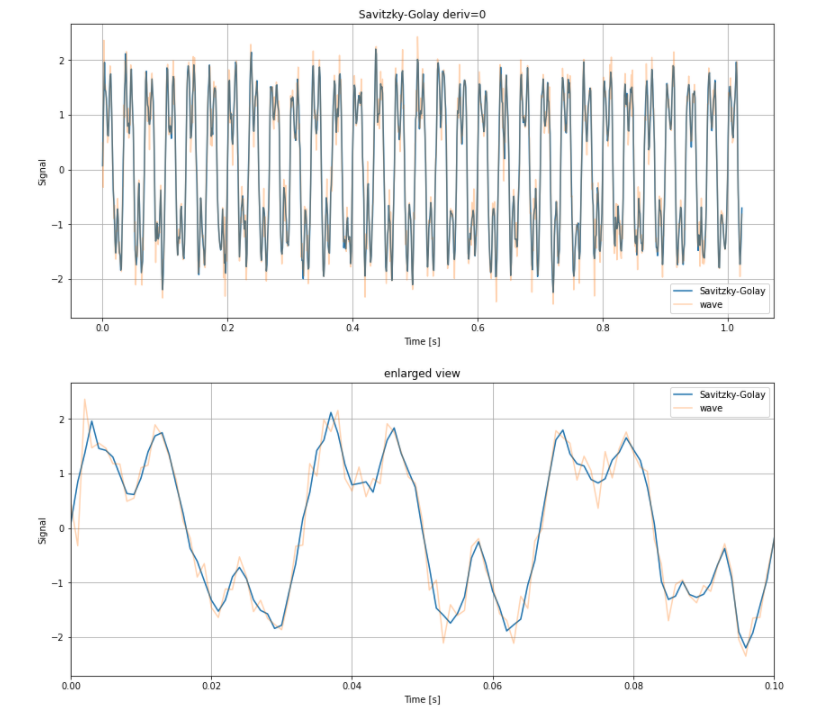
2. Savitzky-Golay filter
2.1 微分しないパターン
import scipy.signal

# 多項式の次数: 2
# フレーム長: 5
x = scipy.signal.savgol_filter(wave, 5, 2, deriv=0)

fig, ax = plt.subplots(figsize=(14.0, 6.0))
ax.plot(t, x, label='Savitzky-Golay')
ax.plot(t, wave, alpha=0.3, label='wave')
ax.set_xlabel("Time [s]")
ax.set_ylabel("Signal")
ax.grid()
plt.legend()
plt.title("Savitzky-Golay deriv=0")
plt.show()

fig, ax = plt.subplots(figsize=(14.0, 6.0))
ax.plot(t, x, label='Savitzky-Golay')
ax.plot(t, wave, alpha=0.3, label='wave')
ax.set_xlim(0, 0.1)
ax.set_xlabel("Time [s]")
ax.set_ylabel("Signal")
ax.grid()
plt.legend()
plt.title("enlarged view")
plt.show()
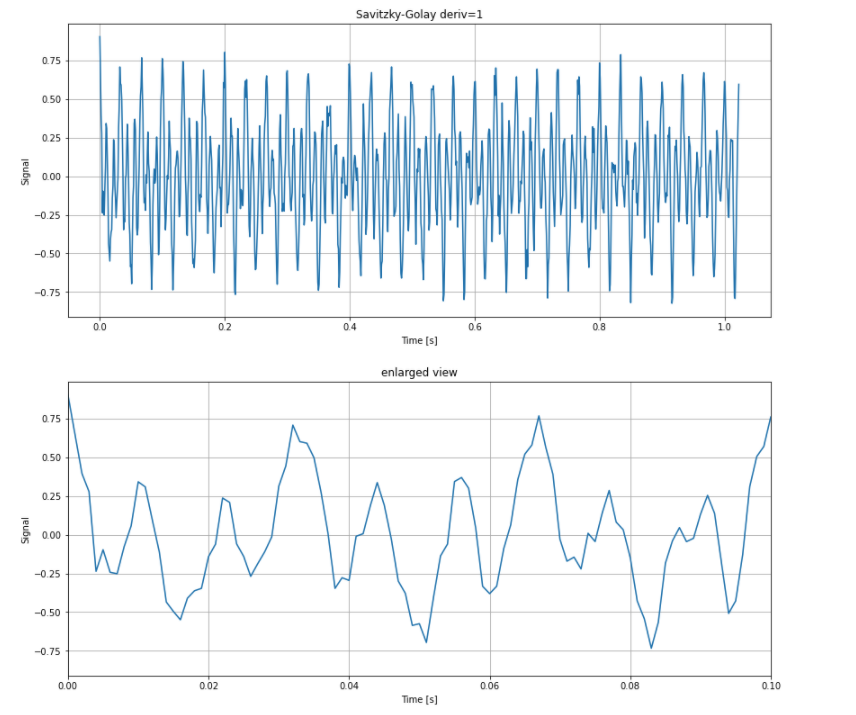
2.2 1階微分
x = scipy.signal.savgol_filter(wave, 5, 2, deriv=1)

fig, ax = plt.subplots(figsize=(14.0, 6.0))
ax.plot(t, x)
ax.set_xlabel("Time [s]")
ax.set_ylabel("Signal")
ax.grid()
plt.title("Savitzky-Golay deriv=1")
plt.show()

fig, ax = plt.subplots(figsize=(14.0, 6.0))
ax.plot(t, x)
ax.set_xlim(0, 0.1)
ax.set_xlabel("Time [s]")
ax.set_ylabel("Signal")
ax.grid()
plt.title("enlarged view")
plt.show()
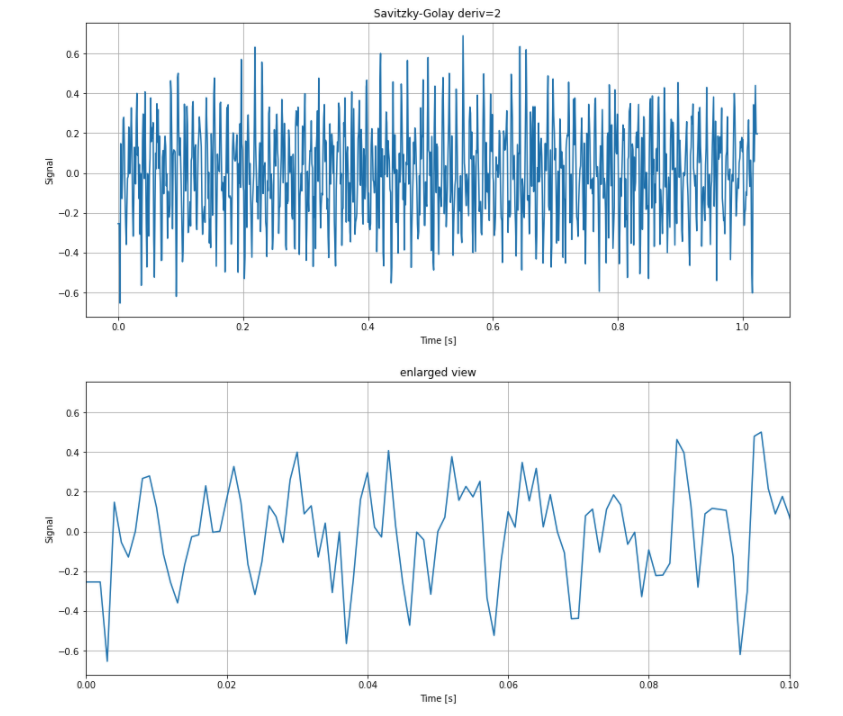
2.3 2階微分
x = scipy.signal.savgol_filter(wave, 5, 2, deriv=2)

fig, ax = plt.subplots(figsize=(14.0, 6.0))
ax.plot(t, x)
ax.set_xlabel("Time [s]")
ax.set_ylabel("Signal")
ax.grid()
plt.title("Savitzky-Golay deriv=2")
plt.show()

fig, ax = plt.subplots(figsize=(14.0, 6.0))
ax.plot(t, x)
ax.set_xlim(0, 0.1)
ax.set_xlabel("Time [s]")
ax.set_ylabel("Signal")
ax.grid()
plt.title("enlarged view")
plt.show()
3. フーリエ変換
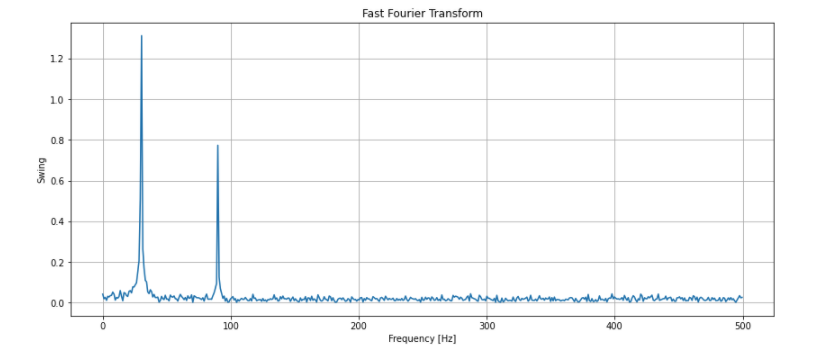
3.1 Fast Fourier Transform
x = np.fft.fft(wave)
x = np.abs(x) # 複素数を絶対値に変換
x = x / N * 2 # 振幅の調整
fq = np.linspace(0, 1.0/dt, N) # 周波数の調整

fig, ax = plt.subplots(figsize=(14.0, 6.0))
ax.plot(fq[: int(N / 2)], x[: int(N / 2)])
ax.set_xlabel("Frequency [Hz]")
ax.set_ylabel("Swing")
ax.grid()
plt.title("Fast Fourier Transform")
plt.show()

# 周波数30, 90、振幅1.5, 0.8あたりにピークが見られる
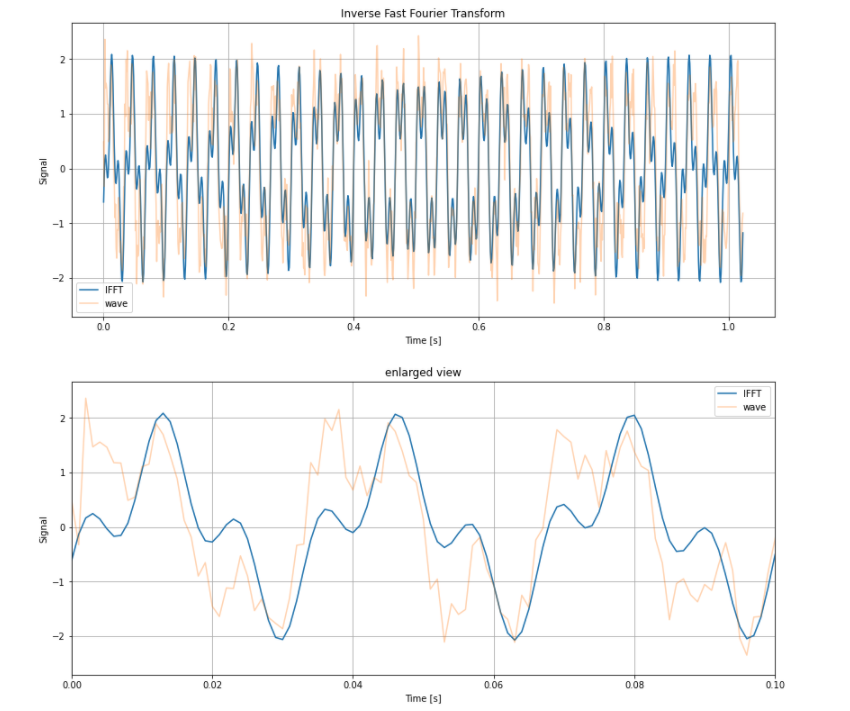
3.2 Inverse Fast Fourier Transform without Noise
threshold = 0.6 # 振幅の閾値

x = np.fft.fft(wave)
x_abs = np.abs(x)
x_abs = x_abs / N * 2
x[x_abs < threshold] = 0

x = np.fft.ifft(x)
x = x.real # 複素数から実数部だけ取り出す

fig, ax = plt.subplots(figsize=(14.0, 6.0))
ax.plot(t, x, label='IFFT')
ax.plot(t, wave, alpha=0.3, label='wave')
ax.set_xlabel("Time [s]")
ax.set_ylabel("Signal")
ax.grid()
plt.legend()
plt.title("Inverse Fast Fourier Transform")
plt.show()

fig, ax = plt.subplots(figsize=(14.0, 6.0))
ax.plot(t, x, label='IFFT')
ax.plot(t, wave, alpha=0.3, label='wave')
ax.set_xlim(0, 0.1)
ax.set_xlabel("Time [s]")
ax.set_ylabel("Signal")
ax.grid()
plt.legend()
plt.title("enlarged view")
plt.show()
時間が取れたら、理論の部分を追記したり、他の手法も記載していきたい。