この記事は何か
adversarial validationとは何かを説明した後に、試しに実装してみたコードを記載する。
備忘録、知識の整理も兼ねてここに記していく。
本記事を投稿するにあたって参考にしたコードはこちら
adversarial validationとは
trainデータの分布がtestデータと異なる場合、validationデータの分布もtrainデータの分布に寄ってしまい、上手くtestデータを予測できないことがある。その時に用いられる手法の一つがadversarial validationである。
adversarial validationとは、trainデータとtestデータを分類するモデルを構築し、それを用いてtestデータになるべく近い分布のvalidationデータを作成することである。
実装
目的変数の作成
trainデータ、testデータに新たな列を作成し、trainデータには0を、testデータには1を入れる。
import pandas as pd

train['target'] = 0
test['target'] = 1

train_test = pd.concat([train, test], axis=0).reset_index(drop=True)
train_test.head()
学習と分類
今回、モデルの構築にはlightgbmを使用した。交差検証を行い、全てのtrainデータに対して、testデータである可能性(probability)を測っている。
import numpy as np
import lightgbm as lgb
from sklearn.model_selection import StratifiedKFold

params = {'objective': 'binary',
          'max_depth': 5,
          'boosting': 'gbdt',
          'metric': 'auc'}

features = [col for col in train_test.columns if col not in ('target',)]
oof_pred = np.zeros((len(train_test), ))
cv = StratifiedKFold(n_splits=5, shuffle=True, random_state=42)

for fold, (train_idx, val_idx) in enumerate(cv.split(train_test, train_test['target'])):
    x_train, x_predict = train_test[features].iloc[train_idx], train_test[features].iloc[val_idx]
    y_train = train_test['target'][train_idx]

    train_set = lgb.Dataset(x_train, label=y_train)

    model = lgb.train(params, train_set)
    oof_pred[val_idx] = model.predict(x_predict).reshape(oof_pred[val_idx].shape)
validationデータの作成
probabilityの値を降順にソートし、(testである可能性が)高い順に任意のデータ数取得し、validationデータを作成する
train_test['probability'] = oof_pred
train = train_test[train_test.target==0].drop('target', axis=1).sort_values('probability', ascending=False)

valid_idx = int(len(train)) / 5 # 今回は決め打ちで上位20%としている

validation_data = train.iloc[:valid_idx]
train_data = train.iloc[valid_idx:]
クラスにしてまとめてみた
class Adversarial_validator:

    def __init__(self, train, test, features, categoricals):
        self.train = train
        self.test = test
        self.features = features
        self.categoricals = categoricals
        self.union_df = self.train_test_union(self.train, self.test)
        self.cv = self.get_cv()
        self.models = []
        self.oof_pred = self.fit()
        self.report_plot()

    def fit(self):
        oof_pred = np.zeros((len(self.union_df), ))

        for fold, (train_idx, val_idx) in enumerate(self.cv):
            x_train, x_predict = self.union_df[self.features].iloc[
                train_idx], self.union_df[self.features].iloc[val_idx]
            y_train = self.union_df['target'][train_idx]
            train_set = self.convert_dataset(x_train, y_train)
            model = self.train_model(train_set)
            self.models.append(model)

            oof_pred[val_idx] = model.predict(
                x_predict).reshape(oof_pred[val_idx].shape)
        self.union_df['prediction'] = oof_pred
        return oof_pred

    def train_test_union(self, train, test):
        train['target'] = 0
        test['target'] = 1
        return pd.concat([train, test], axis=0).reset_index(drop=True)

    def get_cv(self):
        cv = StratifiedKFold(n_splits=5,
                             shuffle=True, random_state=42)

        return cv.split(self.union_df, self.union_df['target'])

    def convert_dataset(self, X, y):
        return lgb.Dataset(X, label=y, categorical_feature=self.categoricals)

    def train_model(self, train_set):
        return lgb.train(self.get_params(), train_set)

    def get_params(self):
        param = {'num_leaves': 50,
                 'num_round': 100,
                 'min_data_in_leaf': 30,
                 'objective': 'binary',
                 'max_depth': 5,
                 'learning_rate': 0.2,
                 'min_child_samples': 20,
                 'boosting': 'gbdt',
                 'feature_fraction': 0.9,
                 'bagging_freq': 1,
                 'bagging_fraction': 0.9,
                 'bagging_seed': 44,
                 'verbose_eval': 50,
                 'metric': 'auc',
                 'verbosity': -1}
        return param

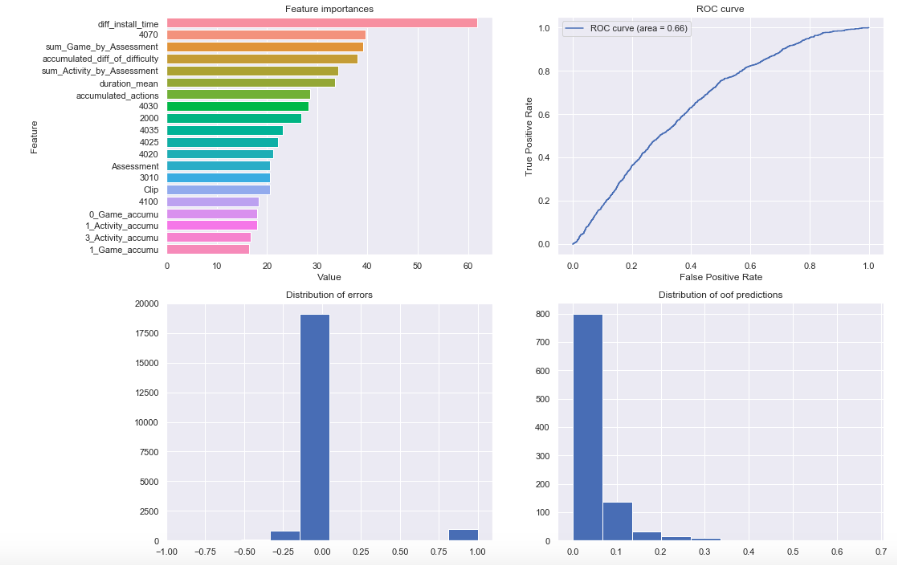
    def report_plot(self):
        fig, ax = plt.subplots(figsize=(16, 12))
        plt.subplot(2, 2, 1)
        self.plot_feature_importance()
        plt.subplot(2, 2, 2)
        self.plot_roc_curve()
        plt.subplot(2, 2, 3)
        plt.hist(self.union_df['target'] - self.oof_pred)
        plt.title('Distribution of errors')
        plt.subplot(2, 2, 4)
        plt.hist(np.random.choice(self.oof_pred, 1000, False))
        plt.title('Distribution of oof predictions')

    def get_feature_importance(self):
        n = len(self.models)
        feature_imp_df = pd.DataFrame()
        for i in range(n):
            tmp = pd.DataFrame(zip(self.models[i].feature_importance(
            ), self.features), columns=['Value', 'Feature'])
            tmp['n_models'] = i
            feature_imp_df = pd.concat([feature_imp_df, tmp])
            del tmp
        self.feature_importance = feature_imp_df
        return feature_imp_df

    def plot_feature_importance(self, n=20):
        imp_df = self.get_feature_importance().groupby(
            ['Feature'])[['Value']].mean().reset_index(False)
        imp_top_df = imp_df.sort_values('Value', ascending=False).head(n)
        sns.barplot(data=imp_top_df, x='Value', y='Feature', orient='h')
        plt.title('Feature importances')

    def plot_roc_curve(self):
        fpr, tpr, thresholds = metrics.roc_curve(
            self.union_df['target'], self.oof_pred)
        auc = metrics.auc(fpr, tpr)

        plt.plot(fpr, tpr, label='ROC curve (area = %.2f)' % auc)
        plt.legend()
        plt.title('ROC curve')
        plt.xlabel('False Positive Rate')
        plt.ylabel('True Positive Rate')

adv = Adversarial_validator(train, test, features, categoricals)
データはkaggleコンペの2019 Data Science Bowlのデータを使用している。
validationデータ作成以外の活用法
- importanceの高い特徴量を削除してtrainデータの分布をtestデータに近づける
- 学習時のデータの重みづけの参考(weight_column)
まとめ
簡単にだがadversarial validationについて紹介してみた。この記事を読んだ方の一助になれば幸いである。
