概要
Google earth engine上には多数のデータが用意されています。特にMODISセンサーに基づいたプロダクトは多く、広く使われています。しかしながら、MODISプロダクトはmodis sinusoidalと呼ばれる投影法に基づいており、そのままでは一般的な緯度経度座標への投影になっていません。pyproj等を用いた投影変換も可能ですが、GEEを用いる事で、緯度経度座標でのダウンロードが可能です。本記事では、複数年に渡るデータをまとめてダウンロードしつつ、投影変換を行い、日付情報を付加してgoogle driveへ保存する方法についてご紹介したいと思います。
データ
今回ダウンロードしたのは、地表面反射率の8日間平均であるMOD09A1プロダクトです。以下の画像はmodis sinusoidalがどの様に設定されているのかを示したものです。見慣れた形式(緯度経度)と比べて、ひしゃげた様な形状になっているのが分かります(画像ソース)。sinusoidal projectionの簡単な歴史や投影法の特徴については、Wikipediaに載っています。
コード
以下のコードについては、以下のリンク からGoogle ColabにてNotebook形式でもアクセスが可能です。
GEEbulkDownload.py
!pip install earthengine-api
!pip install unidecode
!pip install geetools

import ee

# Googleアカウントの認証を求められます
ee.Authenticate()
ee.Initialize()

from geetools import batch
from tqdm import tqdm

# パラメータの設定

# ダウンロードしたいプロダクト名
productName="MODIS/006/MOD09A1"

# 検索期間の開始日
startDate='-01-01'

# 検索期間の終了日
endDate='-01-30'

# 画像を保存したいフォルダ名
FolderName='SurfaceReflectance_MOD09A1'

# ダウンロードしたいバンドの指定
# 赤、緑、青、赤外
band=['sur_refl_b01','sur_refl_b03','sur_refl_b04','sur_refl_b05']


# 長方形での対象領域の設定
# 詳しい情報: https://developers.google.com/earth-engine/apidocs/ee-geometry-rectangle
ROI=ee.Geometry.Rectangle(coords=[140,35.9,140.5,36.2])

# 対象年の指定
start_y=2016 #開始年
end_y=2019 #終了年
years=[y for y in range(start_y,end_y+1)]


# ダウンロードの実行

for y in tqdm(years):
  #カウンタの初期化
  cnt=0

  #対象領域・対象期間におけるデータを検索
  start=f'{y}'+startDate
  end=f'{y}'+endDate
  ImageCollection_at_y=ee.ImageCollection(productName).filterDate(ee.Date(start), ee.Date(end)).select(band).filterBounds(ROI)

  #検索結果をリスト形式へ変換
  list_of_data=ImageCollection_at_y.toList(ImageCollection_at_y.size().getInfo())

  for d in range(list_of_data.size().getInfo()):
    #画像取得日をファイル名へ指定
    name=ee.Image(list_of_data.get(cnt)).date().format('yyyy-MM-dd').getInfo()
    task=ee.batch.Export.image.toDrive(
        description= f'{y}_{cnt}',
        image=ee.Image(list_of_data.get(cnt)),
        folder=FolderName+f'_{y}', #フォルダ名
        region= ROI,
        fileNamePrefix=name, #ファイル名の指定
        fileFormat= 'GeoTIFF',
        maxPixels= 1e12, #出力される画像のピクセル数上限を設定
        scale=500, #出力画像の空間解像度(m)
        crs='EPSG:4326') #緯度経度座標として、WGS84のEPSGコードを指定
    task.start() #処理の開始
    cnt+=1 #カウンタの更新
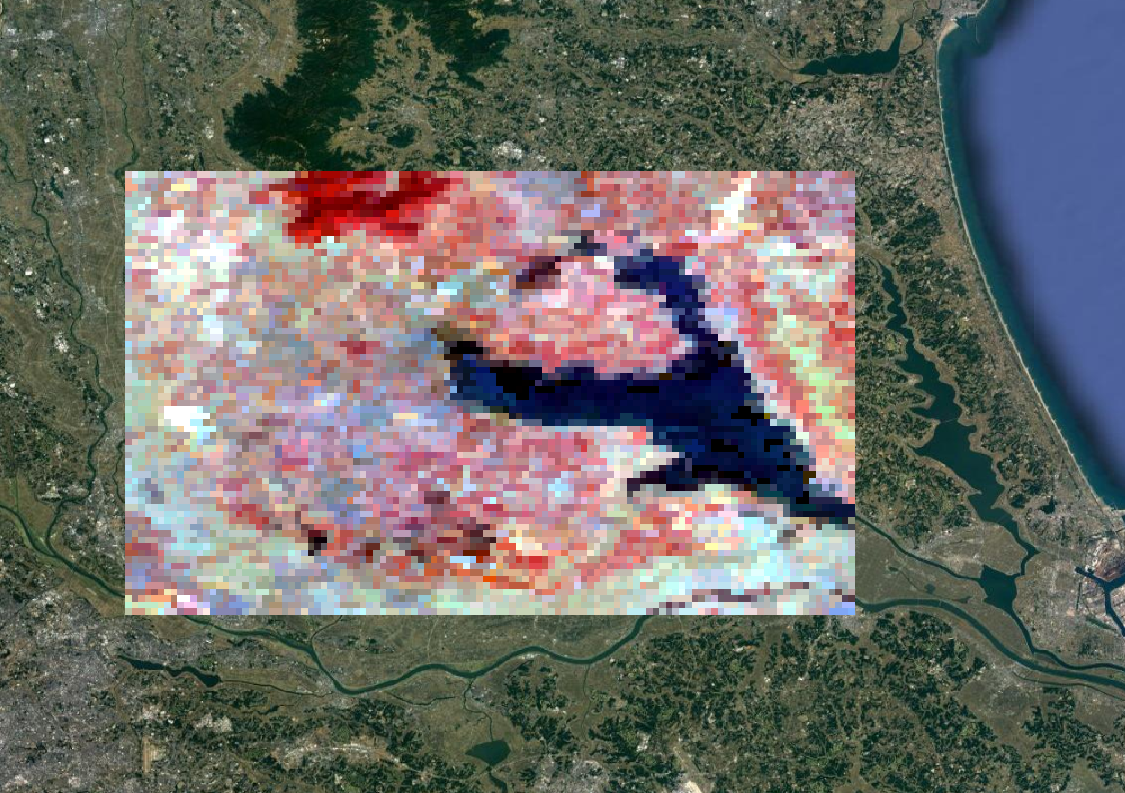
画像の出力例:Google Earthの画像上に重ね合わせてあります。sinusoidal projectionの歪みがなく、表示が一致している事が分かります。バンドの組み合わせは、植生が赤く表示されるフォルスカラー(R/G/B=B5/B1/B4)です。