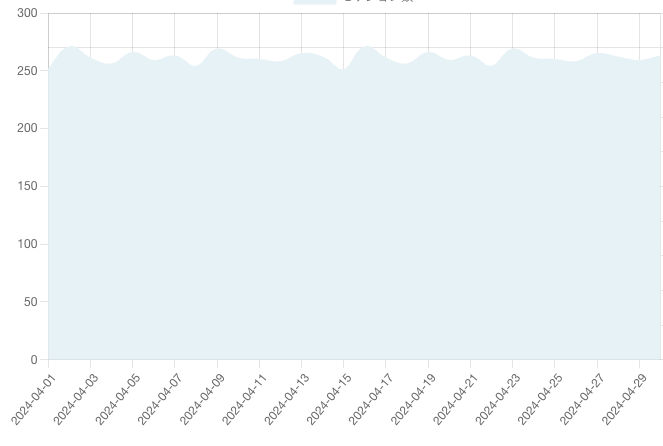
スムーズエリアチャートは、全体的なトレンドを視覚的に理解しやすくしたり、複数のデータセットを比較する際に用いられるチャートです。
今回は Nuxt3 + Chart.jsを使ってスムーズエリアチャートを実装する方法について解説します。
スムーズエリアチャートとは?
こういうチャートのことです。
この1種類だけ出しているとあんまりしっくり来ないんですが、
こんな感じで他のチャートと併用することでトレンドの波が視覚的にわかりやすくなる効果を得ることができます。
Chart.jsとNuxt3を使用した実装
Chart.jsには直接スムーズエリアチャートを表示する機能はありませんが、折れ線グラフのプロパティを変更することでスムーズエリアチャートを実装することができます。
実際のコード例
<template>
    <div class="analysisGraph" :class="layout">
        <div class="chart">
            <p>サンプル</p>
            <div class="chart-container">
                <BarChart v-bind="chartProps" />
            </div>
        </div>
    </div>
</template>
<script setup>
import { Chart, registerables } from "chart.js";
import { BarChart, useBarChart } from "vue-chart-3";

// Chart.jsのプラグインを登録
Chart.register(...registerables);

// グラフデータ
const chartData = computed(() => ({
    labels: ['2024-04-01','2024-04-02','2024-04-03','2024-04-04','2024-04-05','2024-04-06','2024-04-07'],
    datasets: [
        {
            label: "ラベル1",
            data: ['10','15','4','8','25','18','11'],
            borderColor: "#E8F2F5",
            backgroundColor: "#E8F2F5",
            type: "line",
            fill: true, // グラフの下部を塗りつぶす
            lineTension: 0.4, // グラフの曲線を緩やかにする
            pointRadius: 0, // ポイントを非表示
        },
    ],
}));

const { barChartProps: chartProps, barChartRef: chartRef } = useBarChart({
    chartData,
});
</script>
<style lang="scss" scoped>
// スタイルコードは省略
</style>
生成されたチャート
コード例の解説
import { Chart, registerables } from "chart.js";
import { BarChart, useBarChart } from "vue-chart-3";

// Chart.jsのプラグインを登録
Chart.register(...registerables);
まず必要なものをインポートし、Chart.jsを使えるようにします。
// グラフデータ
const chartData = computed(() => ({
    labels: ['2024-04-01','2024-04-02','2024-04-03','2024-04-04','2024-04-05','2024-04-06','2024-04-07'],
    datasets: [
        {
            label: "ラベル1",
            data: ['10','15','4','8','25','18','11'],
            borderColor: "#E8F2F5",
            backgroundColor: "#E8F2F5",
            type: "line",
            fill: true, // グラフの下部を塗りつぶす
            lineTension: 0.4, // グラフの曲線を緩やかにする
            pointRadius: 0, // ポイントを非表示
        },
    ],
}));
ここが今回のポイントとなるグラフデータを設定している箇所です。
スムーズエリアチャートを実装するには以下の設定が必要です。
-
type: "line": 表示するチャートの種類を折れ線グラフに設定します。 -
fill: true: 折れ線グラフの内部を塗りつぶします。塗りつぶしの色はbackgroundColorで指定します。 -
lineTension: 0.4: グラフの線を滑らかにするための設定です。値を大きくするほど曲線が滑らかになります。 -
pointRadius: 0: データポイントを非表示にします。必要に応じて表示することも可能です。
この4つの設定をすることで折れ線グラフがスムーズエリアチャートに生まれ変わります。
const { barChartProps: chartProps, barChartRef: chartRef } = useBarChart({
    chartData,
});
あとはチャートを表示するだけです。
まとめ
今回はChart.jsを用いてスムーズエリアチャートを実装する方法について解説しました。
この手順を参考にすることで、データのトレンドを視覚的に把握しやすいチャートを作成できます。
さまざまな種類のチャートを実装できるようにしておくことで、データの可視化がより柔軟に行えるようになりますので、ぜひ皆さんもトライしてみてください。


