デンドログラムを使ったクラスター分析
まずはモジュールをインポート
import pandas as pd
import numpy as np
from scipy.cluster.hierarchy import dendrogram, linkage, fcluster
Sicpyのlinkageモジュールを使ってクラスタリングを行う
df = pd.DataFrame(np.random.rand(16*21).reshape(21,16))
Z = linkage(df,method=“ward”,metric=“euclidean”)
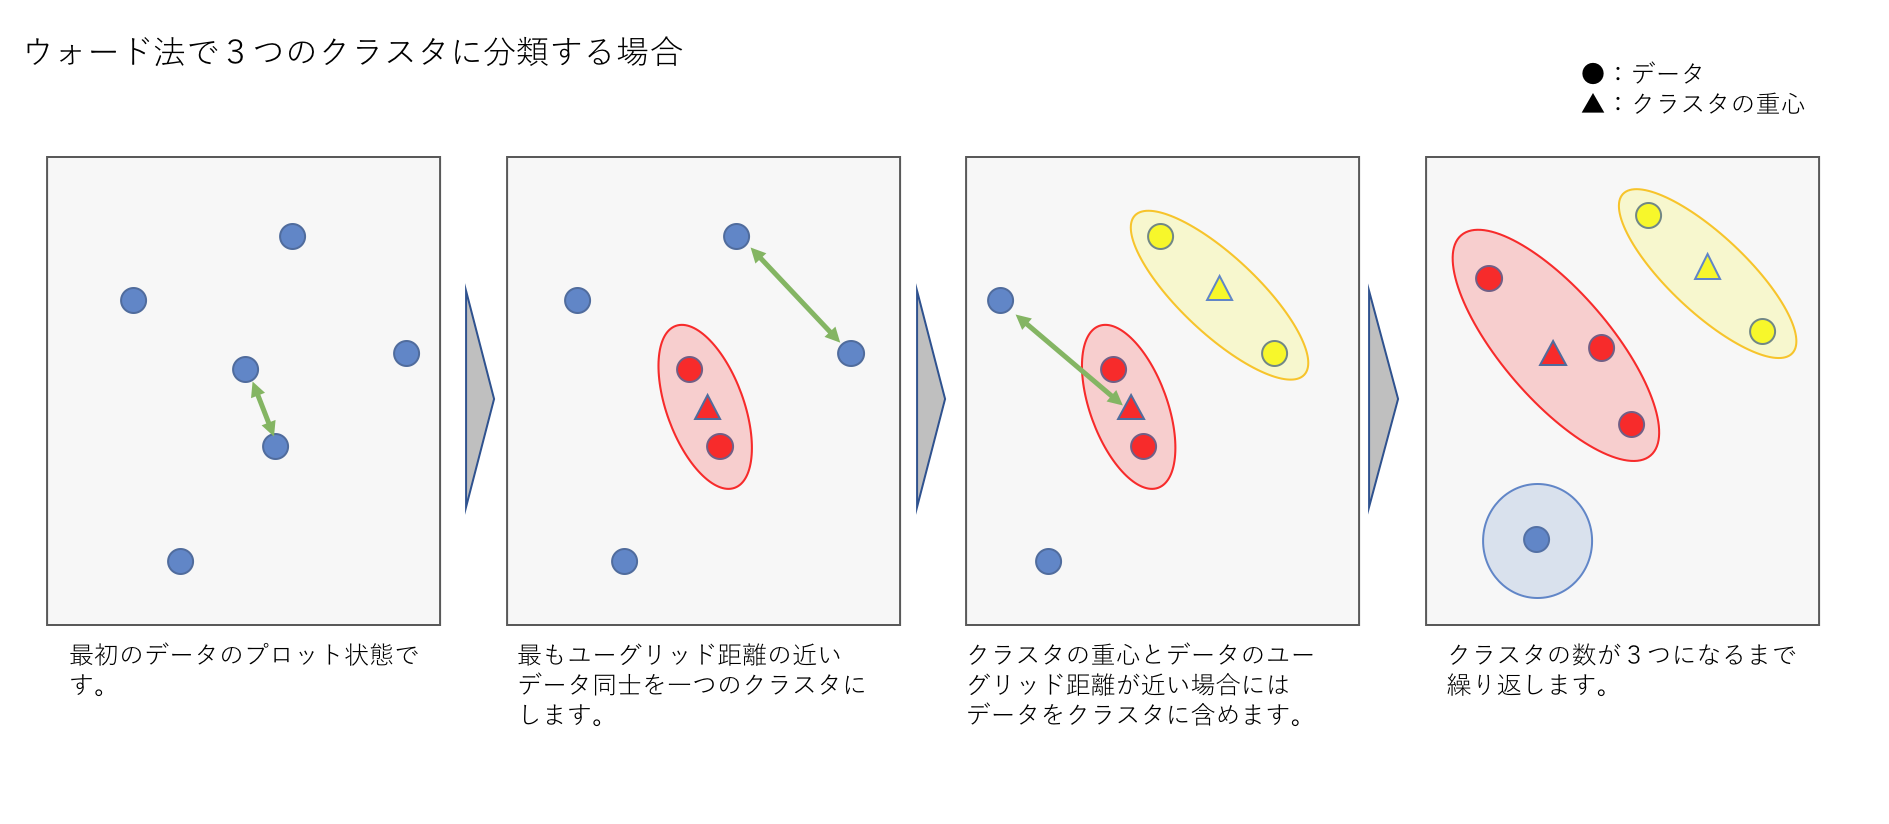
引数に指定したウォード法*ユークリッドとは
- 全てのプロットからユークリッド距離で最も近い点から一つのグループにしていく。
- 点が2つ以上集まってグループになった場合はグループの重心を基準とする。
- 点もしくは重心が近い順にグループを作っていき、基準のグループ数になるまで繰り返す。

linkageによるクラスタリングの結果
print(Z)
array([[ 11. , 20. , 0.92471513, 2. ],
[ 10. , 12. , 1.08875376, 2. ],
[ 19. , 21. , 1.12041408, 3. ],
[ 4. , 14. , 1.150806 , 2. ],
[ 2. , 17. , 1.17779008, 2. ],
[ 6. , 16. , 1.1882572 , 2. ],
[ 1. , 18. , 1.30151643, 2. ],
[ 0. , 3. , 1.30560064, 2. ],
[ 7. , 24. , 1.31414489, 3. ],
[ 9. , 13. , 1.41213736, 2. ],
[ 15. , 22. , 1.45311791, 3. ],
[ 8. , 27. , 1.56889545, 3. ],
[ 26. , 28. , 1.65328324, 4. ],
[ 23. , 31. , 1.71708152, 6. ],
[ 30. , 34. , 1.76940529, 8. ],
[ 32. , 33. , 1.88579743, 7. ],
[ 5. , 25. , 1.89117548, 3. ],
[ 29. , 37. , 1.97406633, 6. ],
[ 36. , 38. , 2.65469797, 13. ],
[ 35. , 39. , 2.98823501, 21. ]])
データの組み合わせを表すため、arrayの数はデータ個数-1となる。
linkageアレイの見方
一行目
print(Z[0,0], Z[0,1]) # 元々のデータフレームのindexを表示
11, 20
print(Z[0,2]) # データ11とデータ20のユーグリッド距離を表示
0.92471513
print(Z[0,3]) # グルーピングしたデータの個数(グループに含まれるデータの個数を含む)を表示
2
三行目
print(Z[2,0], Z[2,1]) # データのindexを表示
19, 21
21->個別のデータの個数は全部で21個なのでindexは0~20までのはず。
実は21以降はグルーピングされたデータの集合を表す。
つまり21はZ[0:]でグルーピングされたデータの集合を表す。
print(Z[2,2]) # データ19とZ[0:]でグルーピングされたデータ集合の重心との距離を表示
1.12041408
print(Z[2,3]) # グルーピングされたデータの個数を表示
3
データ21はもともとデータ11とデータ20の集合なので、ここでグルーピングされたデータの個数は3個となる。
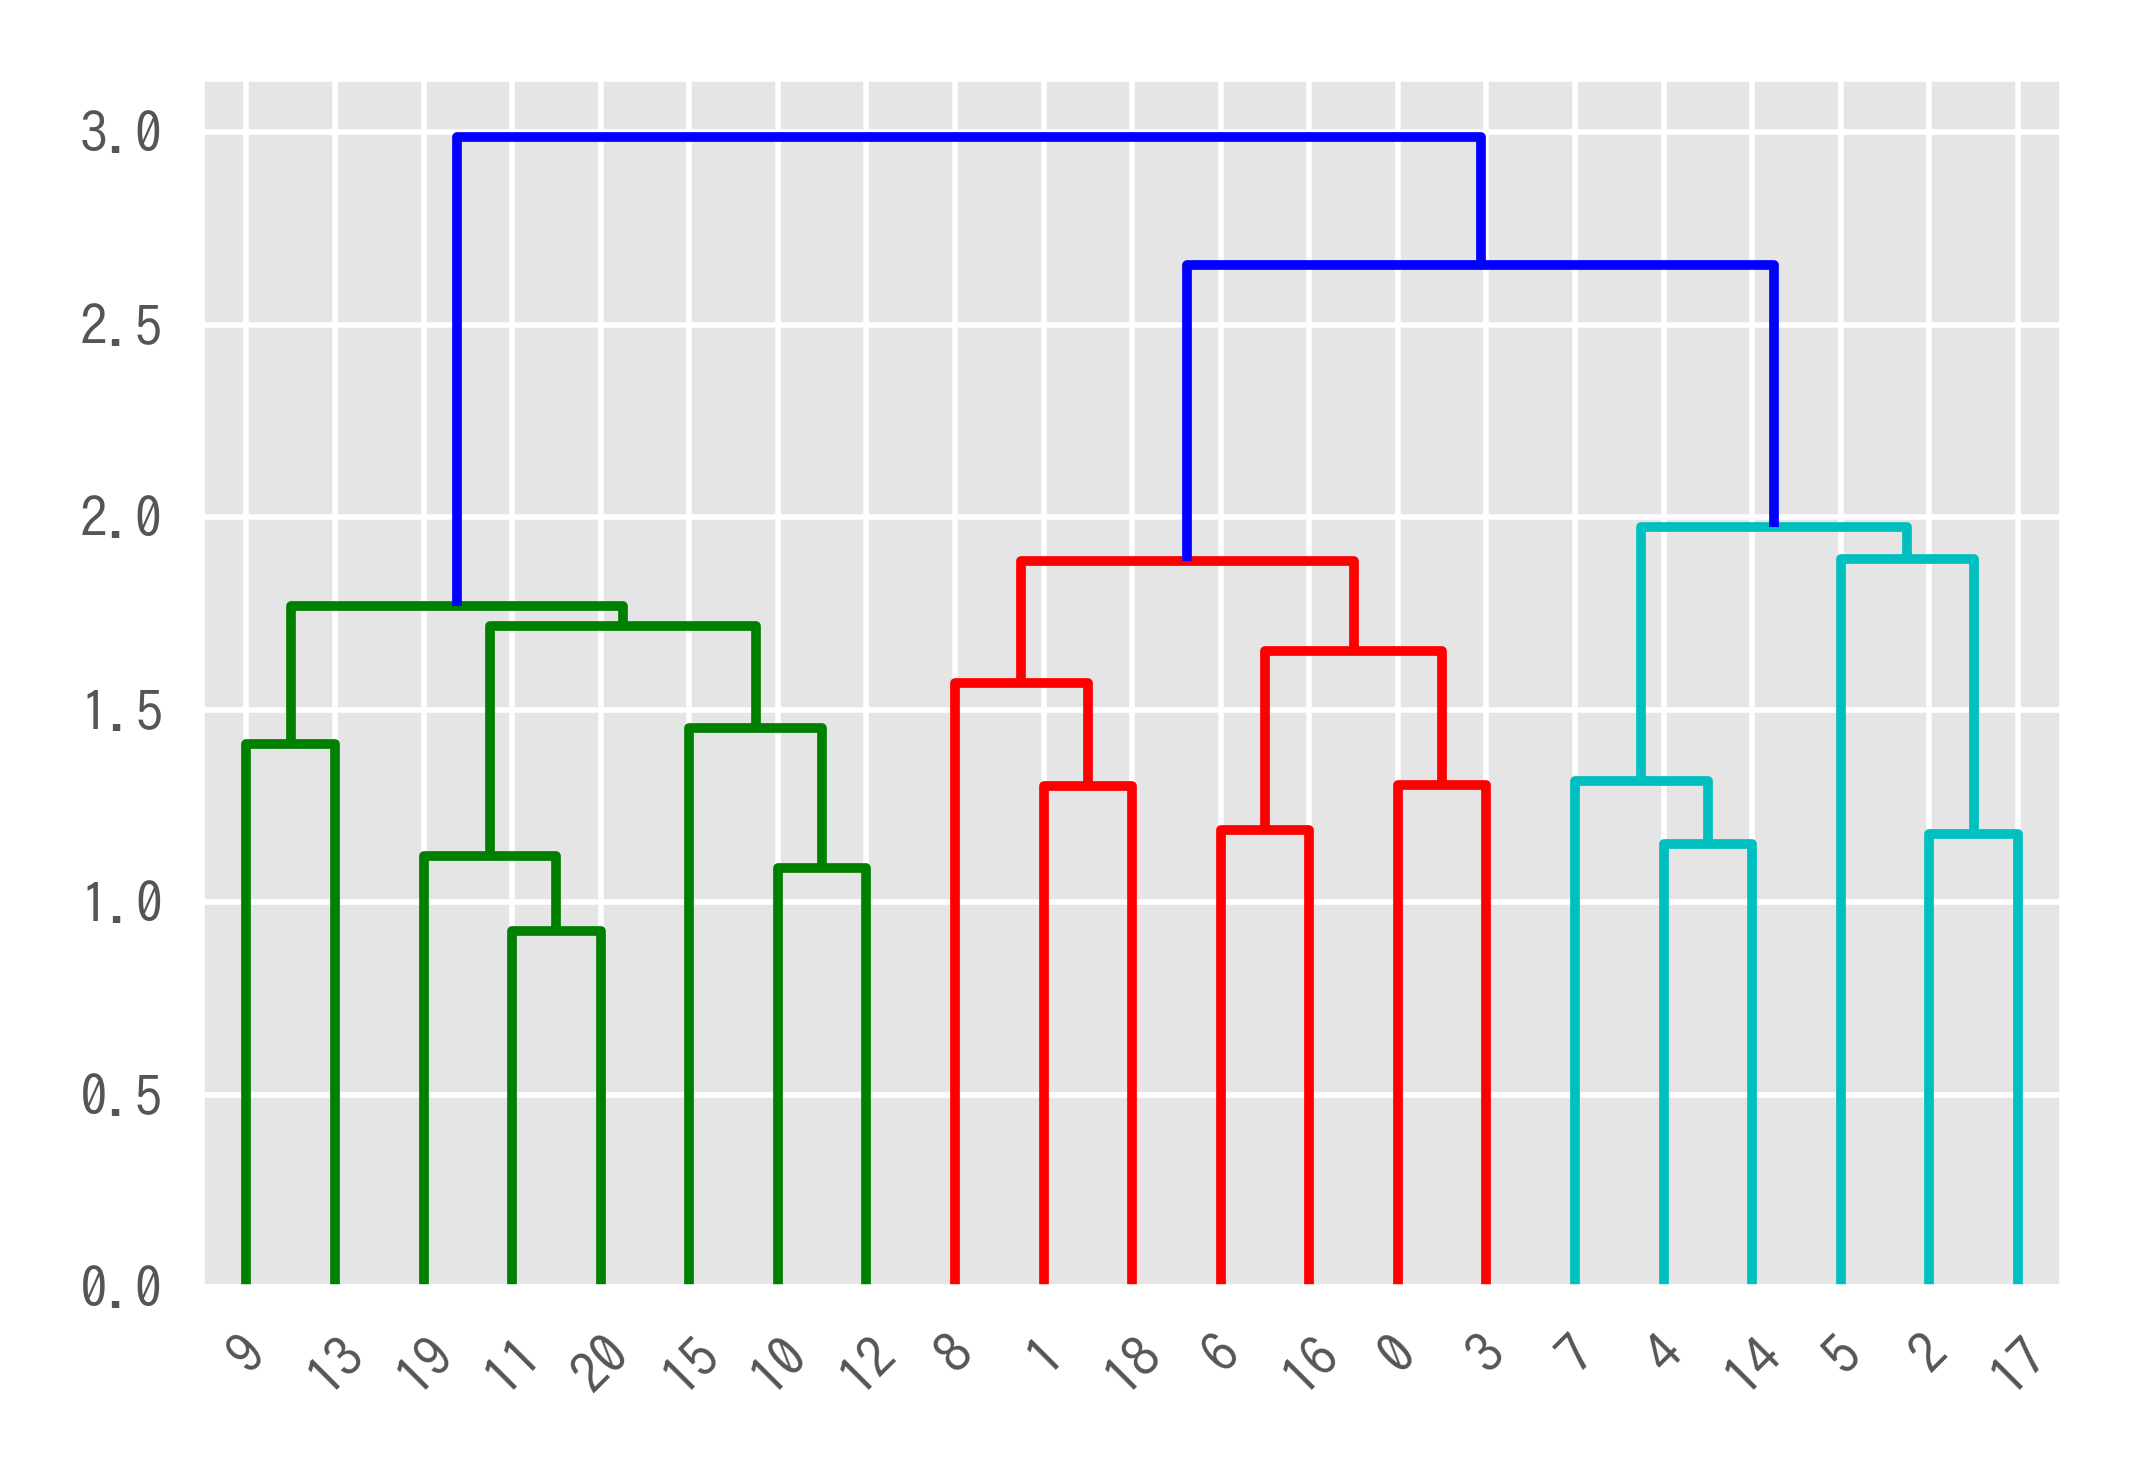
デンドログラムを表示
dendrogram(Z)
デンドログラムの見方
- Y軸はユーグリッド距離を表す。
- X軸はデータのラベルを表す。ラベルを指定しない場合は元データのindex。
- 水平に引かれているラインのY軸はZ[i:2]に対応する。
- 例えば11と20の分岐点の水平ラインのY軸はZ[0,2]に対応する。(最もユーグリッド距離が近い)
- 色分けはデフォルトで最大ユーグリッド距離の70%で設定されている。0.7*max(Z[:,2])
クラスタリングラベルの付与
t = 0.7*max(Z[:,2])
c = fcluster(Z, t, criterion=“distance”)
# t:クラスタリングするユーグリッド距離の基準
# この場合、ユークリッド距離の最も離れている一番上の水平線の70%の位置をクラスタリングの基準とする
print(c) # 元データのindex順に分類値を表示
array([2, 2, 3, 2, 3, 3, 2, 3, 2, 1, 1, 1, 1, 1, 3, 1, 2, 3, 2, 1, 1], dtype=int32)
格数字とデンドログラムにおける色の対応は以下の通り
1:cian
2:red
3:green
最後に
あとは元々のデータフレームにクラスタリングラベル列を追加し、分類ごとの比較などを行うことができます。
以上
