LoginSignup
2

More than 5 years have passed since last update.

StanとRでベイズ統計モデリング(アヒル本)をPythonにしてみる - 12.3 変化点検出

Last updated at Posted at 2018-08-21

実行環境

インポート

import numpy as np
import pandas as pd
import pystan
import matplotlib.pyplot as plt
from matplotlib.figure import figaspect
%matplotlib inline

データ読み込み

changepoint = pd.read_csv('./data/data-changepoint.txt')

12.3 変化点検出

data = dict(
    T=changepoint.index.size,
    Y=changepoint['Y']
)
stanmodel = pystan.StanModel('./stan/model12-7.stan')
fit = stanmodel.sampling(data=data, pars=('mu', 's_mu', 's_Y'), seed=1234, n_jobs=-1)
_, (ax1, ax2) = plt.subplots(1, 2, figsize=figaspect(3/8), sharex=True, sharey=True)

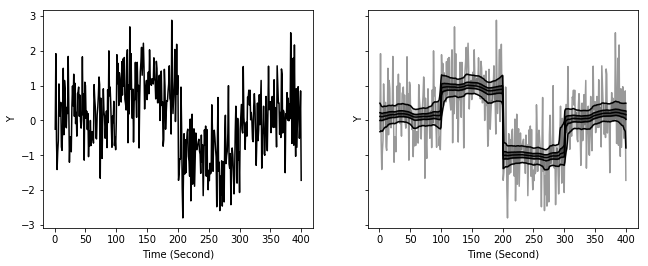
ax1.plot('X', 'Y', data=changepoint, color='k')
plt.setp(ax1, xlabel='Time (Second)', ylabel='Y')

ms = fit.extract()
probs = (2.5, 25, 50, 75, 97.5)
columns = ['p{}'.format(p) for p in probs]
d_est = pd.DataFrame(np.percentile(ms['mu'], probs, axis=0).T, columns=columns)
d_est['x'] = d_est.index + 1
ax2.fill_between('x', 'p2.5', 'p97.5', data=d_est, color='k', alpha=0.2)
ax2.fill_between('x', 'p25', 'p75', data=d_est, color='k', alpha=0.4)
for col in columns:
    ax2.plot('x', col, data=d_est, color='k')
ax2.plot('X', 'Y', data=changepoint, color='k', alpha=0.4)
plt.setp(ax2, xlabel='Time (Second)', ylabel='Y')

plt.show()

fig12-5.png

Register as a new user and use Qiita more conveniently

  1. You get articles that match your needs
  2. You can efficiently read back useful information
  3. You can use dark theme
What you can do with signing up
2