インポート
import pickle
import numpy as np
import pandas as pd
import statsmodels.formula.api as smf
import pystan
import matplotlib.pyplot as plt
from matplotlib.figure import figaspect
from matplotlib import colors as mcolors
import seaborn as sns
%matplotlib inline
データ読み込み
salary = pd.read_csv('./data/data-salary.txt', header=0)
4.4 単回帰
salary.iloc[np.r_[0:3, -1]]
4.4.2 データの分布の確認
salary.plot(x='X', y='Y', kind='scatter')
4.4.4 Rのlm関数で推定
model = smf.ols('Y ~ X', data=salary)
res = model.fit()
res.params
Intercept -119.697132
X 21.904201
dtype: float64
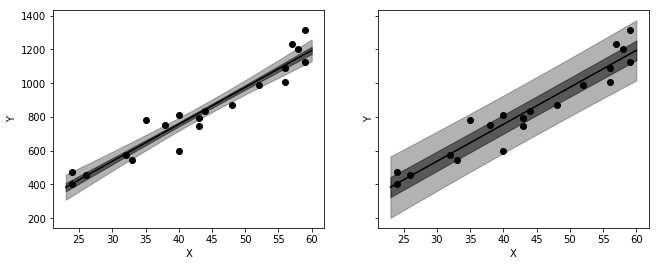
X_new = pd.DataFrame(data=np.arange(23, 61).reshape((-1, 1)), columns=['X'])
predictions = res.get_prediction(X_new)
int_95 = predictions.summary_frame(alpha=0.05)
int_50 = predictions.summary_frame(alpha=0.5)

x, y = X_new['X'], int_95['mean']

_, axes = plt.subplots(1, 2, figsize=figaspect(3/8), sharex=True, sharey=True)
for ax, category in zip(axes, ['mean', 'obs']):
    color = 'k'
    ax.scatter(salary['X'], salary['Y'], c=color)
    ax.plot(x, y, c=color)
    lower = '{}_ci_lower'.format(category)
    upper = '{}_ci_upper'.format(category)
    ax.fill_between(x, int_50[lower], int_50[upper], color=color, alpha=0.5)
    ax.fill_between(x, int_95[lower], int_95[upper], color=color, alpha=0.3)
    plt.setp(ax, xlabel='X', ylabel='Y')
plt.show()
4.4.6 Rからの実行方法
sample_file = './sample/model4-5'
data = dict(
    N=salary.index.size,
    X=salary['X'],
    Y=salary['Y']
)
fit = pystan.stan(file='./stan/model4-5.stan', data=data, seed=1234, sample_file=sample_file)
4.4.7 RStanの結果の見方
fit
Inference for Stan model: anon_model_760fa0b78af0bbaaa934d1350faefc45.
4 chains, each with iter=2000; warmup=1000; thin=1;
post-warmup draws per chain=1000, total post-warmup draws=4000.mean se_mean sd 2.5% 25% 50% 75% 97.5% n_eff Rhata -123.5 2.04 76.4 -272.3 -169.8 -122.9 -73.9 26.33 1404 1.0
b 22.0 0.05 1.7 18.68 20.89 21.97 23.06 25.38 1361 1.0
sigma 85.34 0.44 15.62 61.78 73.94 83.32 94.41 121.4 1256 1.0
lp__ -93.65 0.05 1.33 -97.01 -94.26 -93.31 -92.68 -92.14 828 1.0Samples were drawn using NUTS at Thu Aug 16 11:49:54 2018.
For each parameter, n_eff is a crude measure of effective sample size,
and Rhat is the potential scale reduction factor on split chains (at
convergence, Rhat=1).
4.4.8 収束診断をファイルへ出力する
fit.plot()
plt.setp(plt.gcf(), size_inches=figaspect(3/2) * 1.5)
plt.tight_layout()
plt.show()
names = fit.sim['fnames_oi']
color_list = [mcolors.to_rgba(c) for c in plt.rcParams['axes.prop_cycle'].by_key()['color']]
chains = [pd.read_csv('{name}_{i}.csv'.format(name=sample_file, i=i), usecols=names, engine='python', comment='#') for i in range(fit.sim['chains'])]

_, axes = plt.subplots(len(names), 1, figsize=figaspect(len(names)))
for name, ax in zip(names, axes):
    ax.set_title(name)
    # 対数尤度の描画は時間がかかるので省略
    if name == 'lp__':
        continue
    for i, chain in enumerate(chains):
        ax.plot(chain.index, chain[name], label='Chain{}'.format(i+1))
    ax.legend()
plt.show()
4.4.9 MCMCの設定の変更
stanmodel = pystan.StanModel(file='./stan/model4-5.stan')
data = dict(
    N=salary.shape[0],
    X=salary['X'],
    Y=salary['Y']
)
pars = ('b', 'sigma')
def init():
    return dict(
        a=np.random.uniform(-10, 10, 1)[0],
        b=np.random.uniform(0, 10, 1)[0],
        sigma=10
    )
fit_b = stanmodel.sampling(data=data, pars=pars, init=init, seed=123, chains=3, iter=1000, warmup=200, thin=200)
4.4.10 並列計算の実行方法
# モデルの保存にはpickleを利用
with open('model.pkl', 'wb') as f:
    pickle.dump(fit, f, protocol=pickle.HIGHEST_PROTOCOL)
# 並列計算はn_jobsで指定
stanmodel.sampling(data=data, n_jobs=-1)
4.4.11 ベイズ信頼区間とベイズ予測区間の算出
with open('model.pkl', 'rb') as f:
    fit = pickle.load(f)
ms = fit.extract()
ms['b']
array([21.648502 , 24.32315818, 22.51297332, ..., 18.02090357,
23.9904834 , 22.04242875])
np.percentile(ms['b'], (2.5, 97.5))
array([18.70508043, 25.37697167])
d_mcmc = pd.DataFrame(data=dict(a=ms['a'], b=ms['b'], sigma=ms['sigma']))
d_mcmc.head()
sns.jointplot('a', 'b', data=d_mcmc)
plt.show()
N_mcmc = len(ms['lp__'])
y50_base = ms['a'] + ms['b'] * 50
y50 = np.random.normal(loc=y50_base, scale=ms['sigma'], size=N_mcmc)
d_mcmc = pd.DataFrame(data=dict(a=ms['a'], b=ms['b'], sigma=ms['sigma'], y50_base=y50_base, y50=y50))
d_mcmc.iloc[np.r_[:3, -1]]
ages = X_new['X']
steps = ages.size
median = np.empty(steps)
conf50 = np.empty((steps, 2))
conf95 = np.empty((steps, 2))
pred50 = np.empty((steps, 2))
pred95 = np.empty((steps, 2))
np.random.seed(1234)
for i, age in enumerate(ages):
    base = ms['a'] + ms['b'] * age
    y = np.random.normal(loc=base, scale=ms['sigma'], size=N_mcmc)
    median[i] = np.median(base)
    conf50[i] = np.percentile(base, (25, 75))
    pred50[i] = np.percentile(y, (25, 75))
    conf95[i] = np.percentile(base, (2.5, 97.5))
    pred95[i] = np.percentile(y, (2.5, 97.5))
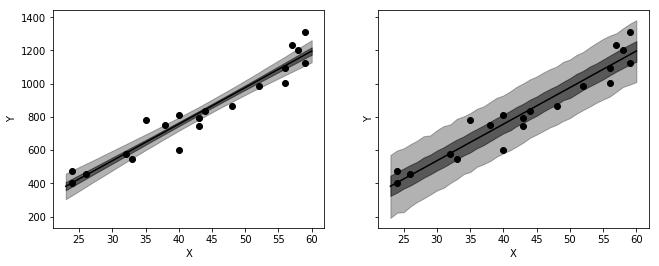
_, axes = plt.subplots(1, 2, figsize=figaspect(3/8), sharex=True, sharey=True)
for interval50, interval95, ax in zip([conf50, pred50], [conf95, pred95], axes):
    color='k'
    ax.scatter('X', 'Y', data=salary, c=color)
    ax.plot(ages, median, c=color)
    ax.fill_between(ages, interval50[:, 0], interval50[:, 1], color=color, alpha=0.5)
    ax.fill_between(ages, interval95[:, 0], interval95[:, 1], color=color, alpha=0.3)
    plt.setp(ax, xlabel='X', ylabel='Y')
plt.show()
4.4.12 transformed parameters ブロックと generated quantities ブロック
X_new = np.arange(23, 61)
data = {col: salary[col] for col in salary.columns}
data.update(dict(
    N=salary.index.size,
    N_new=len(X_new),
    X_new=X_new
))
fit = pystan.stan('./stan/model4-4.stan', data=data, seed=1234)
ms = fit.extract()

def quantile_mcmc(x, y_mcmc, probs=[2.5, 25, 50, 75, 97.5]):
    qua = np.percentile(y_mcmc, probs, axis=0).T
    return pd.DataFrame(np.hstack((x.reshape((-1, 1)), qua)), columns=['X'] + ['p{}'.format(p) for p in probs])

def plot_5quantile(ax, data):
    color = 'k'
    ax.plot('X', 'p50', data=data, color=color)
    ax.fill_between('X', 'p2.5', 'p97.5', data=data, color=color, alpha=1/6)
    ax.fill_between('X', 'p25', 'p75', data=data, color=color, alpha=2/6)
    plt.setp(ax, xlabel='X', ylabel='Y', yticks=np.arange(200, 1401, 400), xlim=(22, 61), ylim=(200, 1400))

plt.figure(figsize=figaspect(3/8))
d_est = quantile_mcmc(x=X_new, y_mcmc=ms['y_base_new'])
ax1 = plt.subplot(121)
plot_5quantile(ax1, d_est)
d_est = quantile_mcmc(x=X_new, y_mcmc=ms['y_new'])
ax2 = plt.subplot(122)
plot_5quantile(ax2, d_est)
plt.show()
ms['y_new'][:6, :4]
array([[350.62655153, 380.55832701, 393.61242951, 367.42299371],
[499.54793356, 476.32663655, 456.6198796 , 373.92625043],
[512.49960072, 415.93237044, 528.00088398, 489.78449245],
[ 63.62170946, 305.60617775, 372.62753946, 466.29639311],
[296.99384618, 429.13932318, 510.96193705, 525.803673 ],
[455.40991609, 442.3794277 , 429.91309597, 333.97571465]])


