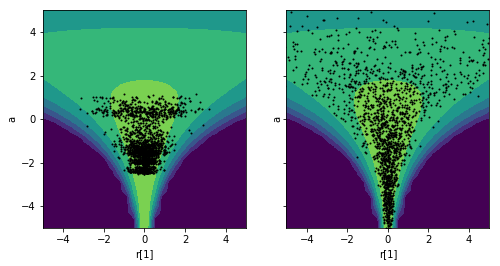
fit_a = pystan.stan('./stan/model10-8a.stan', chains=1, iter=4000, seed=1234)
fit_b = pystan.stan('./stan/model10-8b.stan', chains=1, iter=4000, seed=1234)

ms_a = fit_a.extract()
ms_b = fit_b.extract()

xx, yy = np.mgrid[-5:5:30j, -5:5:30j]
points = np.c_[xx.ravel(), yy.ravel()]
x, y = points[:, 0], points[:, 1]
lp = np.log(stats.norm.pdf(y, loc=0, scale=3)) + np.log(stats.norm.pdf(x, loc=0, scale=np.exp(y/2)))
lp[lp < -15] = -15

_, axes = plt.subplots(1, 2, figsize=figaspect(1/2), sharex=True, sharey=True)
for ms, ax in zip([ms_a, ms_b], axes):
    cs = ax.contourf(xx, yy, lp.reshape(xx.shape), vmin=-15, vmax=0)
    xlim = ax.get_xlim()
    ylim = ax.get_ylim()
    ax.scatter(ms['r'][:, 0], ms['a'], s=1, c='k')
    plt.setp(ax, xlabel='r[1]', ylabel='a', xlim=xlim, ylim=ylim)
plt.show()
