■目的
自宅のInternetの速度がベストエフォートだということで、グラフで確認できるようにします
今回は、今後測定したいものを追加できるように監視ツールとしてZabbixを投入し、
まずpingのRTTレイテンシとspeedtest-cliのDownload/Upload測定値をグラフ化してみてみます
そして、PluginのGrafanaで見やすいグラフにしてみてみます

■Zabbixインストール
ZabbixインストールはZabbixホームページに記載してあり以下のようにインストールしていきます
今回は最新の4.2を使います
Download and install Zabbixホームページ

●1. Install Zabbix repository
[root@my-inst ~]# rpm -Uvh https://repo.zabbix.com/zabbix/4.2/rhel/7/x86_64/zabbix-release-4.2-1.el7.noarch.rpm
    https://repo.zabbix.com/zabbix/4.2/rhel/7/x86_64/zabbix-release-4.2-1.el7.noarch.rpm を取得中
    警告: /var/tmp/rpm-tmp.MGUofB: ヘッダー V4 RSA/SHA512 Signature、鍵 ID a14fe591: NOKEY
    準備しています...              ################################# [100%]
    更新中 / インストール中...
    1:zabbix-release-4.2-1.el7         ################################# [100%]
[root@my-inst ~]# yum clean all
    読み込んだプラグイン:langpacks, ulninfo
    リポジトリーを清掃しています: ol7_UEKR5 ol7_addons ol7_developer ol7_developer_EPEL ol7_ksplice ol7_latest
                                : ol7_optional_latest ol7_software_collections zabbix zabbix-non-supported
    Other repos take up 158 k of disk space (use --verbose for details)
●2. Install Zabbix server, frontend, agent
[root@my-inst ~]# yum -y install zabbix-server-mysql zabbix-web-mysql zabbix-agent
    読み込んだプラグイン:langpacks, ulninfo

    ・・・

    総ダウンロード容量: 18 M
    インストール容量: 64 M
    Downloading packages:
    (1/36): OpenIPMI-libs-2.0.23-2.0.1.el7.x86_64.rpm                                    | 521 kB  00:00:00

    ・・・

    インストール:
    zabbix-agent.x86_64 0:4.2.1-1.el7                   zabbix-server-mysql.x86_64 0:4.2.1-1.el7
    zabbix-web-mysql.noarch 0:4.2.1-1.el7

    依存性関連をインストールしました:
    OpenIPMI-libs.x86_64 0:2.0.23-2.0.1.el7            OpenIPMI-modalias.x86_64 0:2.0.23-2.0.1.el7
    apr.x86_64 0:1.4.8-3.el7_4.1                       apr-util.x86_64 0:1.5.2-6.0.1.el7
    dejavu-fonts-common.noarch 0:2.33-6.el7            dejavu-sans-fonts.noarch 0:2.33-6.el7
    fping.x86_64 0:3.10-4.el7                          httpd.x86_64 0:2.4.6-89.0.1.el7_6
    httpd-tools.x86_64 0:2.4.6-89.0.1.el7_6            libX11.x86_64 0:1.6.5-2.el7
    libX11-common.noarch 0:1.6.5-2.el7                 libXau.x86_64 0:1.0.8-2.1.el7
    libXpm.x86_64 0:3.5.12-1.el7                       libjpeg-turbo.x86_64 0:1.2.90-6.el7
    libtool-ltdl.x86_64 0:2.4.2-22.el7_3               libxcb.x86_64 0:1.13-1.el7
    libxslt.x86_64 0:1.1.28-5.0.1.el7                  libzip.x86_64 0:0.10.1-8.el7
    mailcap.noarch 0:2.1.41-2.el7                      net-snmp-libs.x86_64 1:5.7.2-37.el7
    php.x86_64 0:5.4.16-46.el7                         php-bcmath.x86_64 0:5.4.16-46.el7
    php-cli.x86_64 0:5.4.16-46.el7                     php-common.x86_64 0:5.4.16-46.el7
    php-gd.x86_64 0:5.4.16-46.el7                      php-ldap.x86_64 0:5.4.16-46.el7
    php-mbstring.x86_64 0:5.4.16-46.el7                php-mysql.x86_64 0:5.4.16-46.el7
    php-pdo.x86_64 0:5.4.16-46.el7                     php-xml.x86_64 0:5.4.16-46.el7
    t1lib.x86_64 0:5.1.2-14.el7                        unixODBC.x86_64 0:2.3.1-11.el7
    zabbix-web.noarch 0:4.2.1-1.el7

    完了しました!
●3. MySQL Install
[root@my-inst ~]# yum install mariadb-server
        読み込んだプラグイン:langpacks, ulninfo

        ・・・

        依存性を解決しました

        ============================================================================================================
        Package                           アーキテクチャー バージョン                   リポジトリー          容量
        ============================================================================================================
        インストール中:
        mariadb-server                    x86_64           1:5.5.60-1.el7_5             ol7_latest            11 M
        依存性関連でのインストールをします:
        perl-Compress-Raw-Bzip2           x86_64           2.061-3.el7                  ol7_latest            32 k
        perl-Compress-Raw-Zlib            x86_64           1:2.061-4.el7                ol7_latest            57 k
        perl-DBD-MySQL                    x86_64           4.023-6.0.1.el7              ol7_latest           140 k
        perl-DBI                          x86_64           1.627-4.el7                  ol7_latest           801 k
        perl-Data-Dumper                  x86_64           2.145-3.el7                  ol7_latest            47 k
        perl-IO-Compress                  noarch           2.061-2.el7                  ol7_latest           259 k
        perl-Net-Daemon                   noarch           0.48-5.el7                   ol7_latest            50 k
        perl-PlRPC                        noarch           0.2020-14.el7                ol7_latest            35 k

        トランザクションの要約
        ============================================================================================================
        インストール  1 パッケージ (+8 個の依存関係のパッケージ)

        総ダウンロード容量: 12 M
        インストール容量: 62 M
        Is this ok [y/d/N]: y
        Downloading packages:
        (1/9): perl-Compress-Raw-Bzip2-2.061-3.el7.x86_64.rpm                                |  32 kB  00:00:00
        (2/9): perl-Compress-Raw-Zlib-2.061-4.el7.x86_64.rpm                                 |  57 kB  00:00:00
        (3/9): perl-DBD-MySQL-4.023-6.0.1.el7.x86_64.rpm                                     | 140 kB  00:00:00
        (4/9): perl-DBI-1.627-4.el7.x86_64.rpm                                               | 801 kB  00:00:00
        (5/9): mariadb-server-5.5.60-1.el7_5.x86_64.rpm                                      |  11 MB  00:00:00
        (6/9): perl-Data-Dumper-2.145-3.el7.x86_64.rpm                                       |  47 kB  00:00:00
        (7/9): perl-IO-Compress-2.061-2.el7.noarch.rpm                                       | 259 kB  00:00:00
        (8/9): perl-Net-Daemon-0.48-5.el7.noarch.rpm                                         |  50 kB  00:00:00
        (9/9): perl-PlRPC-0.2020-14.el7.noarch.rpm                                           |  35 kB  00:00:00
        ------------------------------------------------------------------------------------------------------------
        合計                                                                         73 MB/s |  12 MB  00:00:00
        Running transaction check
        Running transaction test
        Transaction test succeeded
        Running transaction
        インストール中          : perl-Compress-Raw-Bzip2-2.061-3.el7.x86_64                                  1/9
        インストール中          : 1:perl-Compress-Raw-Zlib-2.061-4.el7.x86_64                                 2/9
        インストール中          : perl-IO-Compress-2.061-2.el7.noarch                                         3/9
        インストール中          : perl-Data-Dumper-2.145-3.el7.x86_64                                         4/9
        インストール中          : perl-Net-Daemon-0.48-5.el7.noarch                                           5/9
        インストール中          : perl-PlRPC-0.2020-14.el7.noarch                                             6/9
        インストール中          : perl-DBI-1.627-4.el7.x86_64                                                 7/9
        インストール中          : perl-DBD-MySQL-4.023-6.0.1.el7.x86_64                                       8/9
        インストール中          : 1:mariadb-server-5.5.60-1.el7_5.x86_64                                      9/9
        検証中                  : 1:mariadb-server-5.5.60-1.el7_5.x86_64                                      1/9
        検証中                  : perl-Net-Daemon-0.48-5.el7.noarch                                           2/9
        検証中                  : perl-Data-Dumper-2.145-3.el7.x86_64                                         3/9
        検証中                  : perl-IO-Compress-2.061-2.el7.noarch                                         4/9
        検証中                  : perl-DBD-MySQL-4.023-6.0.1.el7.x86_64                                       5/9
        検証中                  : 1:perl-Compress-Raw-Zlib-2.061-4.el7.x86_64                                 6/9
        検証中                  : perl-DBI-1.627-4.el7.x86_64                                                 7/9
        検証中                  : perl-Compress-Raw-Bzip2-2.061-3.el7.x86_64                                  8/9
        検証中                  : perl-PlRPC-0.2020-14.el7.noarch                                             9/9

        インストール:
        mariadb-server.x86_64 1:5.5.60-1.el7_5

        依存性関連をインストールしました:
        perl-Compress-Raw-Bzip2.x86_64 0:2.061-3.el7          perl-Compress-Raw-Zlib.x86_64 1:2.061-4.el7
        perl-DBD-MySQL.x86_64 0:4.023-6.0.1.el7               perl-DBI.x86_64 0:1.627-4.el7
        perl-Data-Dumper.x86_64 0:2.145-3.el7                 perl-IO-Compress.noarch 0:2.061-2.el7
        perl-Net-Daemon.noarch 0:0.48-5.el7                   perl-PlRPC.noarch 0:0.2020-14.el7

        完了しました!
●4. MySQL設定
[root@my-inst ~]# vi /etc/my.cnf.d/server.cnf
    ==>  以下内容を追加更新
        [mysqld]
        character-set-server = utf8
        collation-server     = utf8_bin
        skip-character-set-client-handshake
        innodb_file_per_table
・MySQL設定反映再起動
[root@my-inst ~]# systemctl restart mariadb
・自動起動設定
[root@my-inst ~]# systemctl enable mariadb
    Created symlink from /etc/systemd/system/multi-user.target.wants/mariadb.service to /usr/lib/systemd/system/mariadb.service.
●5. Create initial MySQL database
[root@my-inst ~]# mysql -uroot -p
    Enter password:
        Welcome to the MariaDB monitor.  Commands end with ; or \g.
        Your MariaDB connection id is 3
        Server version: 5.5.60-MariaDB MariaDB Server

        Copyright (c) 2000, 2018, Oracle, MariaDB Corporation Ab and others.

        Type 'help;' or '\h' for help. Type '\c' to clear the current input statement.

    MariaDB [(none)]> create database zabbix character set utf8 collate utf8_bin;
        Query OK, 1 row affected (0.00 sec)

        MariaDB [(none)]> grant all privileges on zabbix.* to zabbix@localhost identified by 'password';
        Query OK, 0 rows affected (0.00 sec)

    MariaDB [(none)]> quit;
        Bye
・Import initial schema and data to MySQL.
[root@my-inst ~]# zcat /usr/share/doc/zabbix-server-mysql*/create.sql.gz | mysql -uzabbix -p zabbix
 Enter password: <--password
●6. Configure the database for Zabbix server
・設定
[root@my-inst ~]# vi /etc/zabbix/zabbix_server.conf
==>以下を設定
 DBPassword=password
・設定確認
[root@my-inst ~]# cat /etc/zabbix/zabbix_server.conf | grep DBPassword
    ### Option: DBPassword
    # DBPassword=
    DBPassword=password
●7. Configure PHP for Zabbix frontend
・設定
[root@my-inst ~]# vi /etc/httpd/conf.d/zabbix.conf
    ==>以下を設定
        # php_value date.timezone Europe/Riga
        php_value date.timezone Asia/Tokyo
・設定確認
[root@my-inst ~]# cat /etc/httpd/conf.d/zabbix.conf
    ・・・
    <IfModule mod_php5.c>
        php_value max_execution_time 300
        php_value memory_limit 128M
        php_value post_max_size 16M
        php_value upload_max_filesize 2M
        php_value max_input_time 300
        php_value max_input_vars 10000
        php_value always_populate_raw_post_data -1
        # php_value date.timezone Europe/Riga
        php_value date.timezone Asia/Tokyo
    </IfModule>
    ・・・
●8. Start Zabbix server and agent processes
[root@my-inst ~]# systemctl restart zabbix-server zabbix-agent httpd
[root@my-inst ~]# systemctl enable zabbix-server zabbix-agent httpd
    Created symlink from /etc/systemd/system/multi-user.target.wants/zabbix-server.service to /usr/lib/systemd/system/zabbix-server.service.
    Created symlink from /etc/systemd/system/multi-user.target.wants/zabbix-agent.service to /usr/lib/systemd/system/zabbix-agent.service.
    Created symlink from /etc/systemd/system/multi-user.target.wants/httpd.service to /usr/lib/systemd/system/httpd.service.
●9. Firewald設定
Zabbixにhttp接続できるようにFirewalldのtcp80ポートを解放する
[root@my-inst ~]# firewall-cmd --permanent --zone public --add-service http
   success
[root@my-inst ~]# firewall-cmd --reload
   success
■Acssece Zabbix
① Webブラウザアクセス

② Check of pre-requisites
[Next Step]クリック

③ Configure DB connection
以下内容を設定し、[Next Step]クリック

④ Zabbix server delails
以下内容を設定し、[Next Step]クリック

⑤ Pre-installation Summary
[Next Step]クリック

⑥ Install
[FInish]クリック

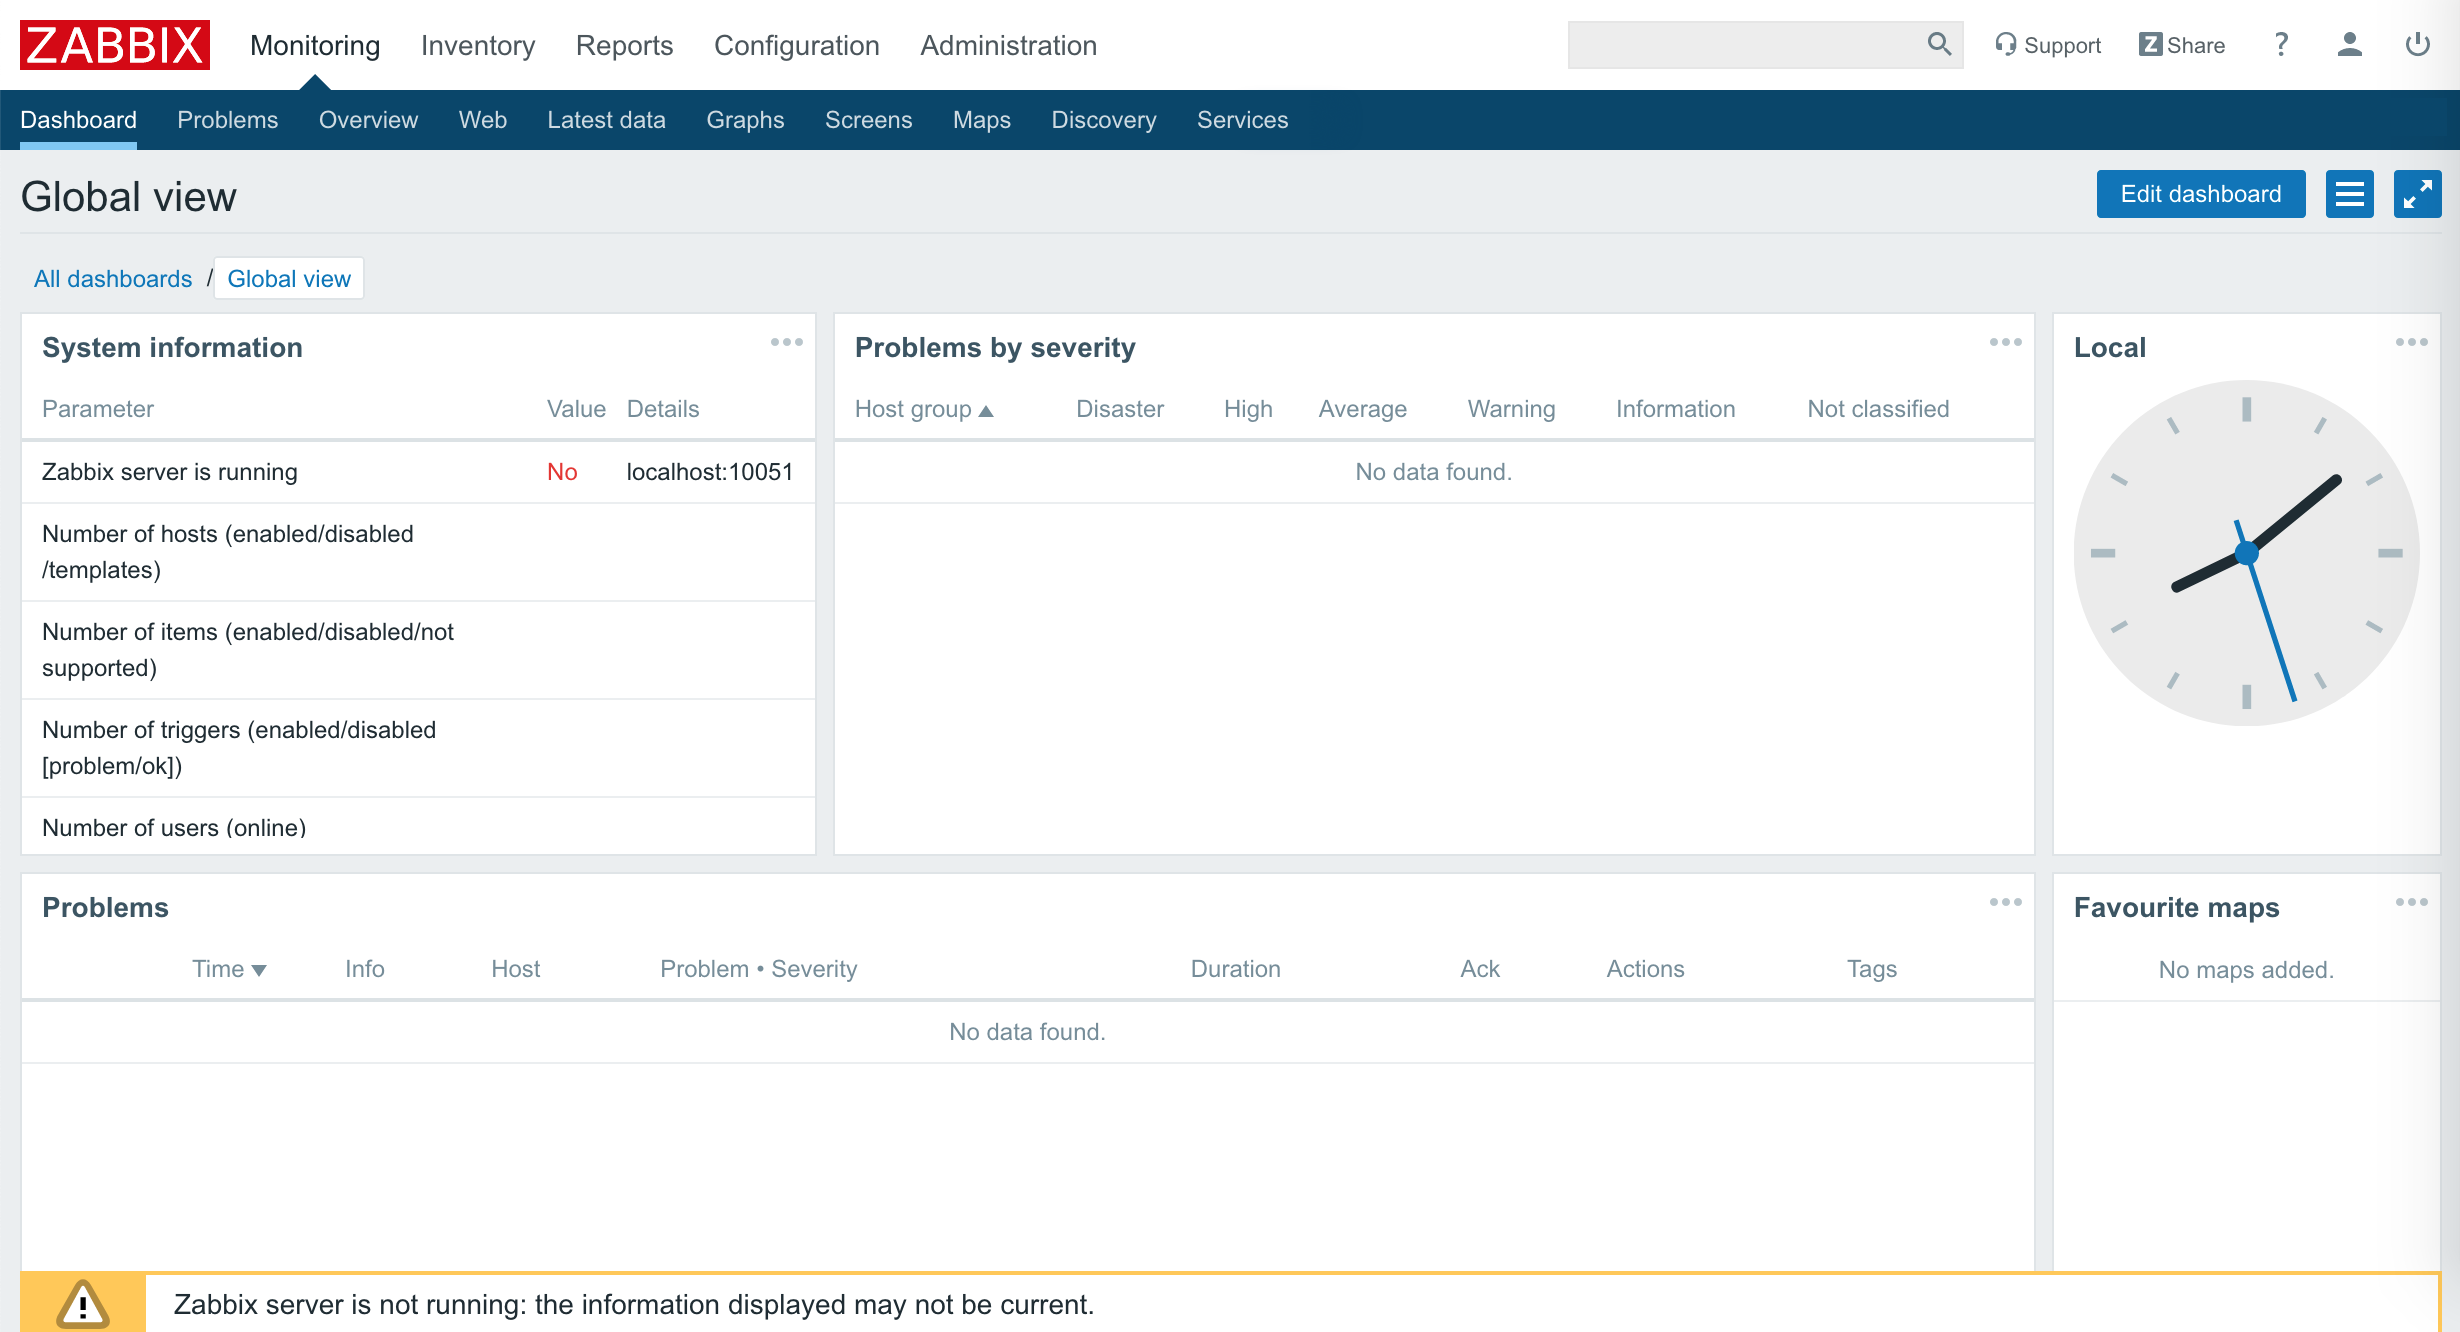
⑦ ログイン
デフォルトユーザーでログイン
Username: Admin
Password: zabbix

⑧ログイン完了
■pingレイテンシ測定監視実装
●zabbix-getインストール
Zabbix getは、Zabbixエージェントと通信して、エージェントから必要な情報を取得するのに使用するコマンドです
[root@my-inst ~]# yum install zabbix-get
        読み込んだプラグイン:langpacks, ulninfo
        依存性の解決をしています
        --> トランザクションの確認を実行しています。
        ---> パッケージ zabbix-get.x86_64 0:4.2.1-1.el7 を インストール
        --> 依存性解決を終了しました。

        依存性を解決しました

        ============================================================================================================
        Package                    アーキテクチャー       バージョン                  リポジトリー            容量
        ============================================================================================================
        インストール中:
        zabbix-get                 x86_64                 4.2.1-1.el7                 zabbix                 285 k

        トランザクションの要約
        ============================================================================================================
        インストール  1 パッケージ

        総ダウンロード容量: 285 k
        インストール容量: 1.2 M
        Is this ok [y/d/N]: y
        Downloading packages:
        zabbix-get-4.2.1-1.el7.x86_64.rpm                                                    | 285 kB  00:00:00
        Running transaction check
        Running transaction test
        Transaction test succeeded
        Running transaction
        インストール中          : zabbix-get-4.2.1-1.el7.x86_64                                               1/1
        検証中                  : zabbix-get-4.2.1-1.el7.x86_64                                               1/1

        インストール:
        zabbix-get.x86_64 0:4.2.1-1.el7

        完了しました!
●レイテンシ計測値SHELL作成
ping を行い平均値(avg)を抜き出しこれを定期的に計測してグラフを作れるようにします
・ping実施
[root@my-inst ~]# ping 8.8.8.8 -c 3
    PING 8.8.8.8 (8.8.8.8): 56 data bytes
    64 bytes from 8.8.8.8: icmp_seq=0 ttl=56 time=50.206 ms
    64 bytes from 8.8.8.8: icmp_seq=1 ttl=56 time=30.554 ms
    64 bytes from 8.8.8.8: icmp_seq=2 ttl=56 time=69.442 ms

    --- 8.8.8.8 ping statistics ---
    3 packets transmitted, 3 packets received, 0.0% packet loss
    rtt min/avg/max/stddev = 30.554/50.067/69.442/15.876 ms
・平均値(avg)抜き出しshell作成
[opc@my-inst ~]$ ping ping-tokyo.sinet.ad.jp -c 3 | grep rtt | awk '{print $4}' |awk -F'/' '{print $2}'
    50.06
これをZabbixのUserParameterに追加します。
●監視登録
作成した監視SHELLをUserParamete項目に追加し、
10秒以上SHELLを実行できるようにTimeout値を拡大します
[root@my-inst ~]# vi /etc/zabbix/zabbix_agentd.conf

    ==>以下を追加
    # Ping latency
    UserParameter=ping.latency[*],ping -c "$2" "$1" |grep rtt | awk '{print $$4}' |awk -F'/' '{print $$2}'

    # Timeout
    Timeout=30
・設定反映再起動
[root@my-inst ~]# service zabbix-agent restart
    Redirecting to /bin/systemctl restart zabbix-agent.service
●動作確認実行
[root@my-inst ~]# zabbix_get -s 127.0.0.1 -k ping.latency[8.8.8.8,10]
    sh: /usr/bin/ping: Permission denied
上記エラーが出る場合はSE Linuxの設定が必要です
ここでは、SE Linuxを停止します
・SE Linux設定
SE Linux設定確認
[root@my-inst ~]# /usr/sbin/getenforce
    Enforcing
SE Linux停止(暫定対処)
[root@my-inst ~]# setenforce 0
SE Linux停止確認
[root@my-inst ~]# /usr/sbin/getenforce
    Permissive
SE Linux停止(恒久対処)
[root@my-inst ~]# vi /etc/selinux/config
SELINUX=disabled
・動作確認
[root@my-inst ~]# zabbix_get -s 127.0.0.1 -k ping.latency[8.8.8.8,10]
    59.974
■Internet速度(Download/Upload)測定監視実装
speedtest-cliを使用して近隣のspeedtestサーバーへDownload/Upload測定を行い。この出力値を使用します
● speedtest-cliインストール
①. speedtest-cliインストール
[root@my-inst ~]# easy_install speedtest-cli
    Searching for speedtest-cli
    Reading https://pypi.python.org/simple/speedtest-cli/
    Best match: speedtest-cli 2.1.1
    Downloading https://files.pythonhosted.org/packages/bb/c0/eb70e8251c5649b7fbaf681424ddd8aa8c0f12b0381e2b8fca8b11f7f5fb/speedtest-cli-2.1.1.tar.gz#sha256=37c9e1fd678285afe4a4b769b748db47d6957b344d5b792bf6ba7dcae6a67ee8
    Processing speedtest-cli-2.1.1.tar.gz
    Writing /tmp/easy_install-S9cehD/speedtest-cli-2.1.1/setup.cfg
    Running speedtest-cli-2.1.1/setup.py -q bdist_egg --dist-dir /tmp/easy_install-S9cehD/speedtest-cli-2.1.1/egg-dist-tmp-HiW80K
    zip_safe flag not set; analyzing archive contents...
    Moving speedtest_cli-2.1.1-py2.7.egg to /usr/lib/python2.7/site-packages
    Adding speedtest-cli 2.1.1 to easy-install.pth file
    Installing speedtest script to /usr/bin
    Installing speedtest-cli script to /usr/bin

    Installed /usr/lib/python2.7/site-packages/speedtest_cli-2.1.1-py2.7.egg
    Processing dependencies for speedtest-cli
    Finished processing dependencies for speedtest-cli
②. version確認
[root@my-inst ~]# speedtest-cli --version
    speedtest-cli 2.1.1
    Python 2.7.5 (default, Apr  9 2019, 16:02:27) [GCC 4.8.5 20150623 (Red Hat 4.8.5-36.0.1)]
③. Tokyoのspeedtestサーバー確認
速度測定する地域内のサーバーを検索し、比較的早いところを選択します
[root@my-inst ~]# speedtest-cli --list | grep Tokyo
    15047) OPEN Project (via 20G SINET) (Tokyo, Japan) [7697.20 km]
    20976) GLBB Japan (Tokyo, Japan) [7697.20 km]
    21569) i3D.net (Tokyo, Japan) [7697.20 km]
    18516) GIAM PING VIETPN.COM (Tokyo, Japan) [7697.20 km]
    24333) Rakuten Mobile , Inc (Tokyo, Japan) [7697.20 km]
④. speedtest実施
[root@my-inst ~]# speedtest-cli --server 15047 --simple
    Ping: 30.083 ms
    Download: 55.29 Mbit/s
    Upload: 59.20 Mbit/s
●Internet速度(Download/Upload)Shell
以下2つの測定ShellをZabbixのUserParameterに追加します
①. Download測定値Shell
[root@my-inst ~]# speedtest-cli --server 15047 --simple | grep Download | awk '{print $2}'
55.29
②. Upload測定値Shell
[root@my-inst ~]# speedtest-cli --server 15047 --simple | grep Upload | awk '{print $2}'
59.20
●監視登録
作成した監視SHELLをUserParamete項目に追加
[root@my-inst ~]# vi /etc/zabbix/zabbix_agentd.conf
==>以下を追加

# Download Speed(Mbit/s)
UserParameter=download.speed[*],speedtest-cli --server "$1" --simple | grep Download | awk '{print $$2}'


# Upload Speed(Mbit/s)
UserParameter=upload.speed[*],speedtest-cli --server "$1" --simple | grep Upload | awk '{print $$2}'
●設定反映再起動
[root@my-inst ~]# service zabbix-agent restart
    Redirecting to /bin/systemctl restart zabbix-agent.service
●動作確認実行
[root@my-inst ~]# zabbix_get -s 127.0.0.1 -k download.speed[15047]
56.04

```shell-session
[root@my-inst ~]# zabbix_get -s 127.0.0.1 -k upload.speed[15047]
59.02
■監視(Item)とGraph登録
●監視(Item)設定
① Webブラウザアクセス
http://127.0.0.1/zabbix/items.php
② Configuration > Hosts をクリック
NAME: 監視対象サーバー(Zabbix Server)選択し、その行にある[Items]をクリック

③ [Create Item]をクリック

④ Item画面
以下内容を設定し、[Add]をクリック
Name:監視名を設定
Key: 監視対象サーバーを設定
Interval: 監視間隔を設定
Applications: カテゴリーを設定

●Graph作成
①Graphs をクリック
Name:グラフ名を設定
Item:作成したItemをaddボタンで追加

②以下内容を設定して[Add]をクリック
Name:グラフ名を設定
Item:作成したItemをaddボタンで追加
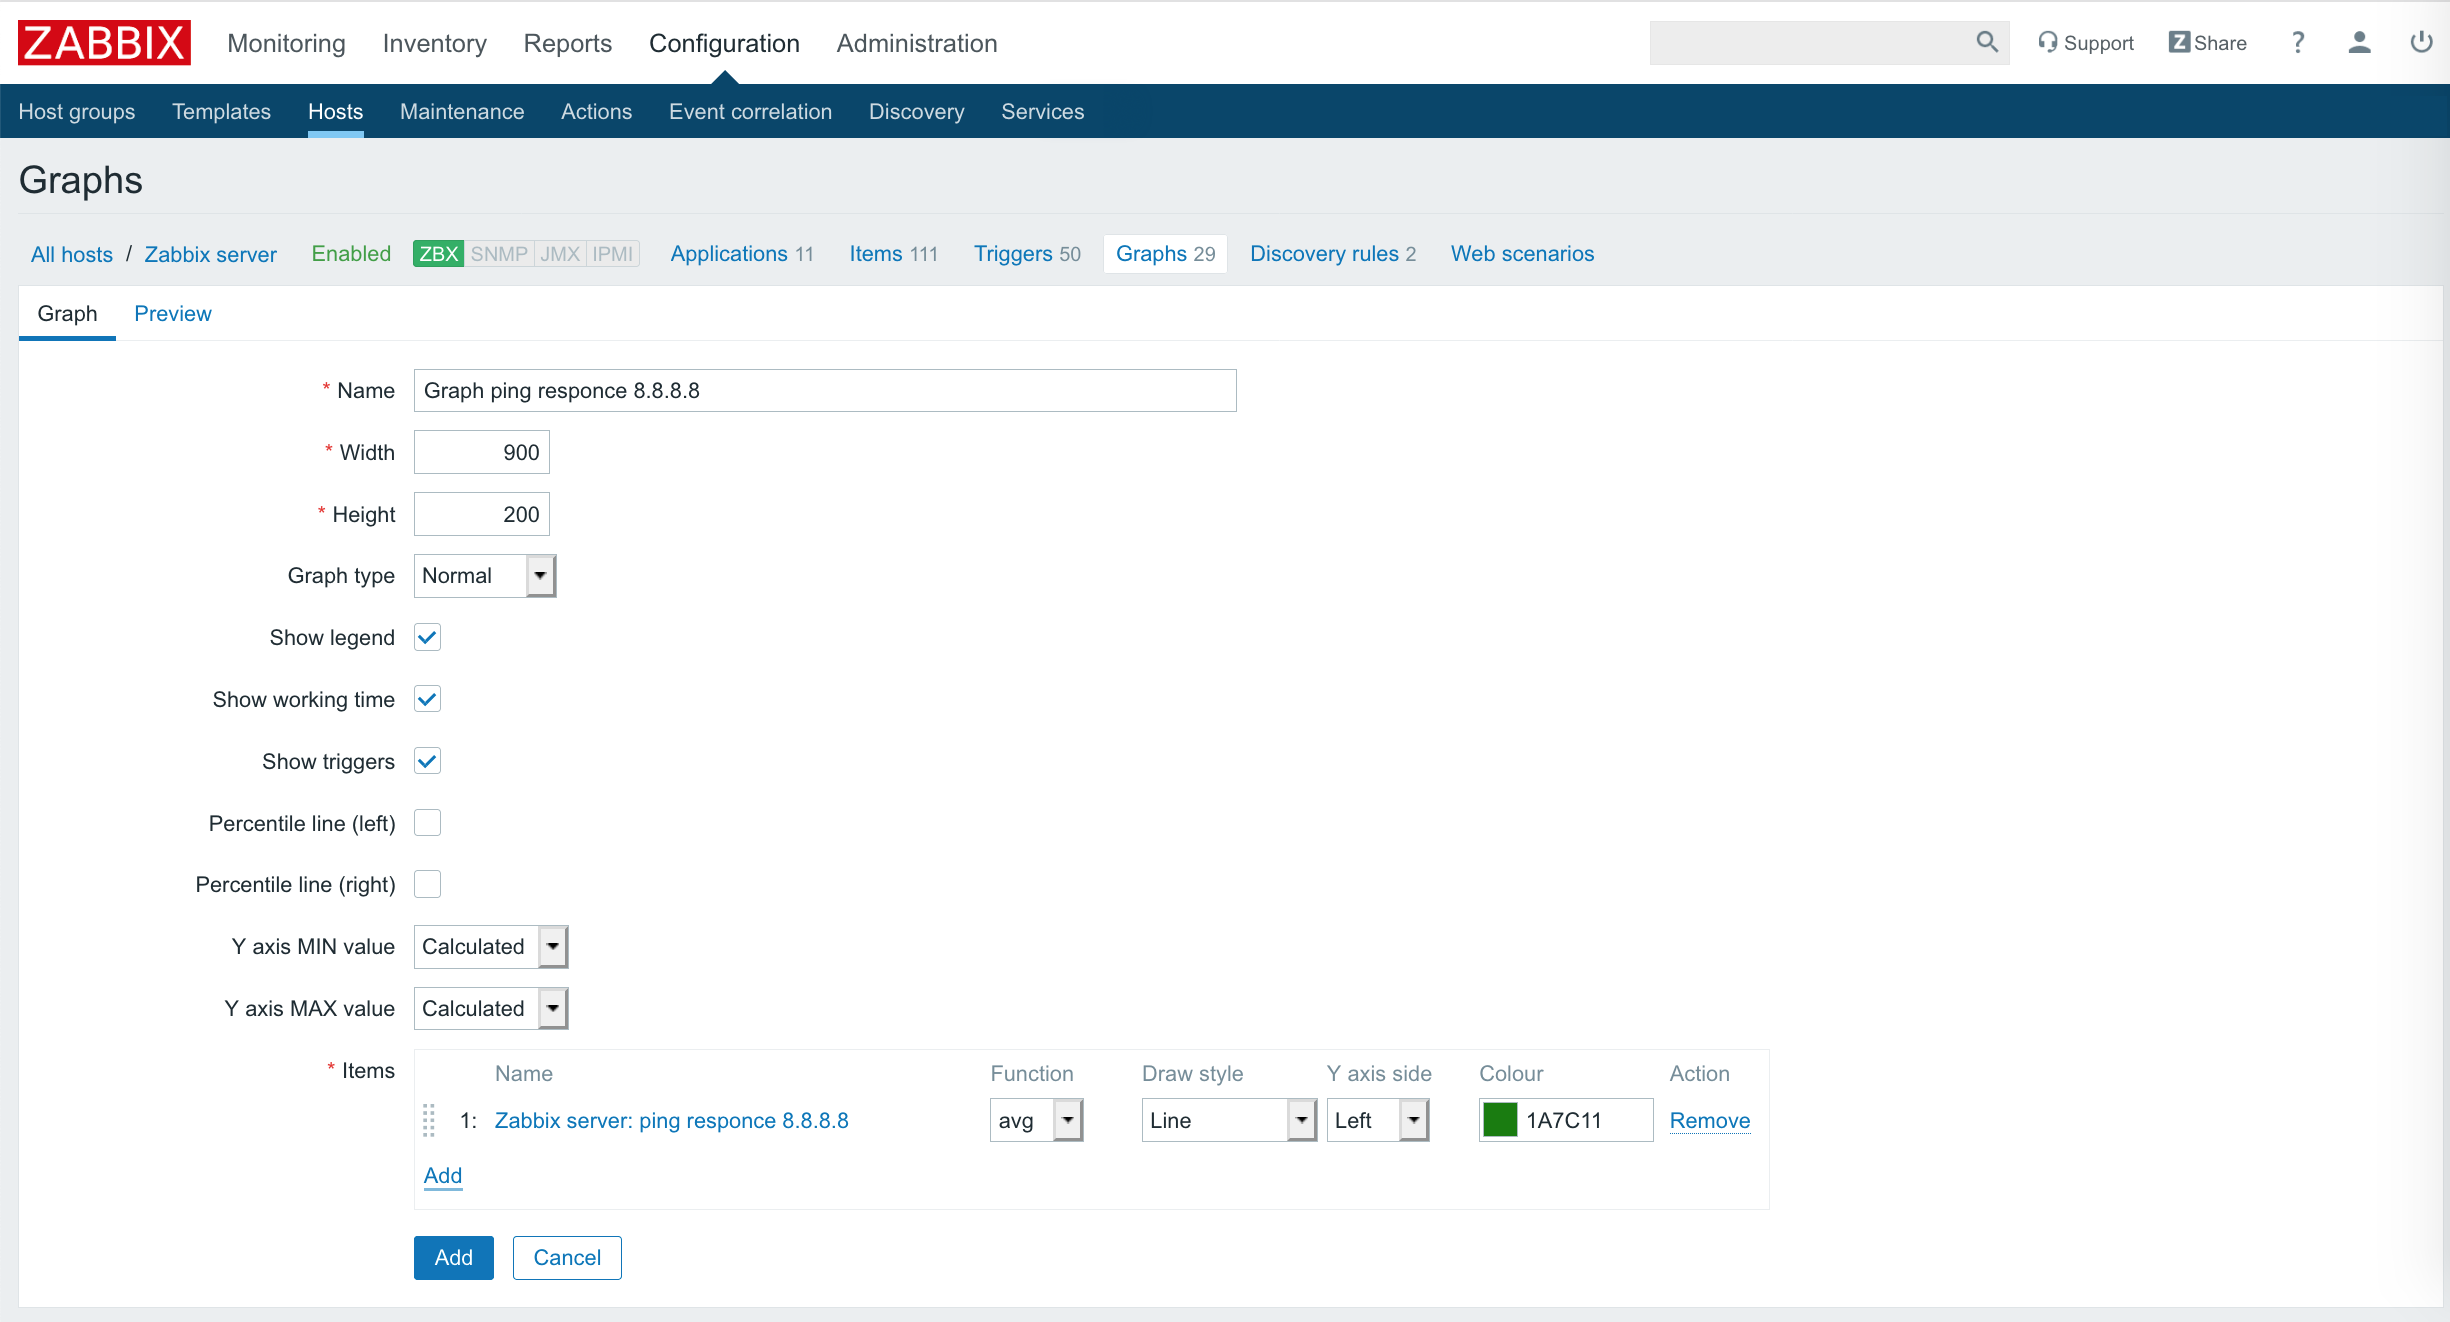
③Previewをクリックしてグラフを確認

■Grafana設定
Grafanaホームページ参照
https://grafana.com/grafana/download?platform=linux

●GrafanaInstall
[root@my-inst opc]# yum install  https://dl.grafana.com/oss/release/grafana-6.2.0-1.x86_64.rpm
        読み込んだプラグイン:langpacks, ulninfo
        grafana-6.2.0-1.x86_64.rpm                                                                                |  56 MB  00:00:02
        /var/tmp/yum-root-WVe4CI/grafana-6.2.0-1.x86_64.rpm を調べています: grafana-6.2.0-1.x86_64
        /var/tmp/yum-root-WVe4CI/grafana-6.2.0-1.x86_64.rpm をインストール済みとして設定しています
        依存性の解決をしています
        --> トランザクションの確認を実行しています。
        ---> パッケージ grafana.x86_64 0:6.2.0-1 を インストール
        --> 依存性の処理をしています: fontconfig のパッケージ: grafana-6.2.0-1.x86_64
        --> 依存性の処理をしています: urw-fonts のパッケージ: grafana-6.2.0-1.x86_64
        --> トランザクションの確認を実行しています。
        ---> パッケージ fontconfig.x86_64 0:2.13.0-4.3.el7 を インストール
        ---> パッケージ urw-fonts.noarch 0:2.4-16.el7 を インストール
        --> 依存性の処理をしています: xorg-x11-font-utils のパッケージ: urw-fonts-2.4-16.el7.noarch
        --> トランザクションの確認を実行しています。
        ---> パッケージ xorg-x11-font-utils.x86_64 1:7.5-21.el7 を インストール
        --> 依存性の処理をしています: libfontenc.so.1()(64bit) のパッケージ: 1:xorg-x11-font-utils-7.5-21.el7.x86_64
        --> トランザクションの確認を実行しています。
        ---> パッケージ libfontenc.x86_64 0:1.1.3-3.el7 を インストール
        --> 依存性解決を終了しました。

        依存性を解決しました

        =================================================================================================================================
        Package                           アーキテクチャー     バージョン                   リポジトリー                           容量
        =================================================================================================================================
        インストール中:
        grafana                           x86_64               6.2.0-1                      /grafana-6.2.0-1.x86_64               161 M
        依存性関連でのインストールをします:
        fontconfig                        x86_64               2.13.0-4.3.el7               ol7_latest                            254 k
        libfontenc                        x86_64               1.1.3-3.el7                  ol7_latest                             30 k
        urw-fonts                         noarch               2.4-16.el7                   ol7_latest                            3.0 M
        xorg-x11-font-utils               x86_64               1:7.5-21.el7                 ol7_latest                            104 k

        トランザクションの要約
        =================================================================================================================================
        インストール  1 パッケージ (+4 個の依存関係のパッケージ)

        合計容量: 165 M
        総ダウンロード容量: 3.4 M
        インストール容量: 166 M
        Is this ok [y/d/N]: y
        Downloading packages:
        (1/4): fontconfig-2.13.0-4.3.el7.x86_64.rpm                                                               | 254 kB  00:00:00
        (2/4): libfontenc-1.1.3-3.el7.x86_64.rpm                                                                  |  30 kB  00:00:00
        (3/4): xorg-x11-font-utils-7.5-21.el7.x86_64.rpm                                                          | 104 kB  00:00:00
        (4/4): urw-fonts-2.4-16.el7.noarch.rpm                                                                    | 3.0 MB  00:00:00
        ---------------------------------------------------------------------------------------------------------------------------------
        合計                                                                                              30 MB/s | 3.4 MB  00:00:00
        Running transaction check
        Running transaction test
        Transaction test succeeded
        Running transaction
        インストール中          : fontconfig-2.13.0-4.3.el7.x86_64                                                                 1/5
        インストール中          : libfontenc-1.1.3-3.el7.x86_64                                                                    2/5
        インストール中          : 1:xorg-x11-font-utils-7.5-21.el7.x86_64                                                          3/5
        インストール中          : urw-fonts-2.4-16.el7.noarch                                                                      4/5
        インストール中          : grafana-6.2.0-1.x86_64                                                                           5/5
        ### NOT starting on installation, please execute the following statements to configure grafana to start automatically using systemd
        sudo /bin/systemctl daemon-reload
        sudo /bin/systemctl enable grafana-server.service
        ### You can start grafana-server by executing
        sudo /bin/systemctl start grafana-server.service
        POSTTRANS: Running script
        検証中                  : libfontenc-1.1.3-3.el7.x86_64                                                                    1/5
        検証中                  : 1:xorg-x11-font-utils-7.5-21.el7.x86_64                                                          2/5
        検証中                  : urw-fonts-2.4-16.el7.noarch                                                                      3/5
        検証中                  : fontconfig-2.13.0-4.3.el7.x86_64                                                                 4/5
        検証中                  : grafana-6.2.0-1.x86_64                                                                           5/5

        インストール:
        grafana.x86_64 0:6.2.0-1

        依存性関連をインストールしました:
        fontconfig.x86_64 0:2.13.0-4.3.el7              libfontenc.x86_64 0:1.1.3-3.el7         urw-fonts.noarch 0:2.4-16.el7
        xorg-x11-font-utils.x86_64 1:7.5-21.el7

        完了しました!
● Zabbix plugin for Grafana インストール
Zabbixプラグインをインストール
[root@my-inst opc]# grafana-cli plugins install alexanderzobnin-zabbix-app
    installing alexanderzobnin-zabbix-app @ 3.10.2
    from url: https://grafana.com/api/plugins/alexanderzobnin-zabbix-app/versions/3.10.2/download
    into: /var/lib/grafana/plugins

    ✔ Installed alexanderzobnin-zabbix-app successfully

    Restart grafana after installing plugins . <service grafana-server restart>
●grafana-server起動
[root@my-inst opc]# service grafana-server start
    Starting grafana-server (via systemctl):                   [  OK  ]

[root@my-inst opc]# systemctl status grafana-server
            ● grafana-server.service - Grafana instance
            Loaded: loaded (/usr/lib/systemd/system/grafana-server.service; enabled; vendor preset: disabled)
            Active: active (running) since 日 2019-05-26 01:49:30 GMT; 7min ago
                Docs: http://docs.grafana.org
            Main PID: 27133 (grafana-server)
            CGroup: /system.slice/grafana-server.service
                    └─27133 /usr/sbin/grafana-server --config=/etc/grafana/grafana.ini --pidfile=/var/run/grafana/grafana-server.pid --...

            5月 26 01:49:30 my-inst grafana-server[27133]: t=2019-05-26T01:49:30+0000 lvl=info msg="Initializing ServerLockServi...erver
            5月 26 01:49:30 my-inst grafana-server[27133]: t=2019-05-26T01:49:30+0000 lvl=info msg="Initializing TracingService"...erver
            5月 26 01:49:30 my-inst grafana-server[27133]: t=2019-05-26T01:49:30+0000 lvl=info msg="Initializing UsageStatsServi...erver
            5月 26 01:49:30 my-inst grafana-server[27133]: t=2019-05-26T01:49:30+0000 lvl=info msg="Initializing UserAuthTokenSe...erver
            5月 26 01:49:30 my-inst grafana-server[27133]: t=2019-05-26T01:49:30+0000 lvl=info msg="Initializing CleanUpService"...erver
            5月 26 01:49:30 my-inst grafana-server[27133]: t=2019-05-26T01:49:30+0000 lvl=info msg="Initializing NotificationSer...erver
            5月 26 01:49:30 my-inst systemd[1]: Started Grafana instance.
            5月 26 01:49:30 my-inst grafana-server[27133]: t=2019-05-26T01:49:30+0000 lvl=info msg="Initializing provisioningSer...erver
            5月 26 01:49:30 my-inst grafana-server[27133]: t=2019-05-26T01:49:30+0000 lvl=info msg="Initializing Stream Manager"
            5月 26 01:49:30 my-inst grafana-server[27133]: t=2019-05-26T01:49:30+0000 lvl=info msg="HTTP Server Listen" logger=h...cket=
            Hint: Some lines were ellipsized, use -l to show in full.
●自動起動設定
[root@my-inst `]# systemctl enable grafana-server.service
●Firewall設定
3000 Portを使用できるようにFirewallを設定
[root@my-inst ~]# firewall-cmd --add-port=3000/tcp
[root@my-inst ~]# firewall-cmd --reload
   success
●Grafanaアクセス
以下URLでブラウザアクセス
http://127.0.0.1:3000/
パスワードはデフォルト admin/admin

●Zabbix Plugin設定
① Zabbixを選択

② [Enable]をクリック

③ 左アイコンの[Configuration]から[Data Source]をクリック

④ [Add data source]をクリック

⑤ Zabbixをクリック

⑥ Data Source設定
以下項目を設定
・HTTP
    URL:http://127.0.0.1/zabbix/api_jsonrpc.php
    Access:Server(Default)

・Zabbix API details
    Username:Grafana連携用のZabbixユーザ
    Password:*******
    Trends:Enable

⑦ [Save & Test] をクリック

⑧ Dashbordタブを選択して、必要なDashbordの[Re-Import]をクリックして登録

#■ Grafana グラフ作成
① 上部にあるHomeアイコンをクリック

② Add Query アイコンをクリック

③ グラフ作成
Group :Zabbix Server
Applications : Zabbixで作成したItemのカテゴリ
Host : Zabbix Server
Item : abbixで作成したItem

必要に応じて[Add Query]をクリックしてItemを追加
④完成
