pythonのアルゴリズムトレードライブラリ
pythonのアルゴリズムトレードライブラリをいくつか紹介したいと思います。私が今回調べたのは以下の4つです。
zipline
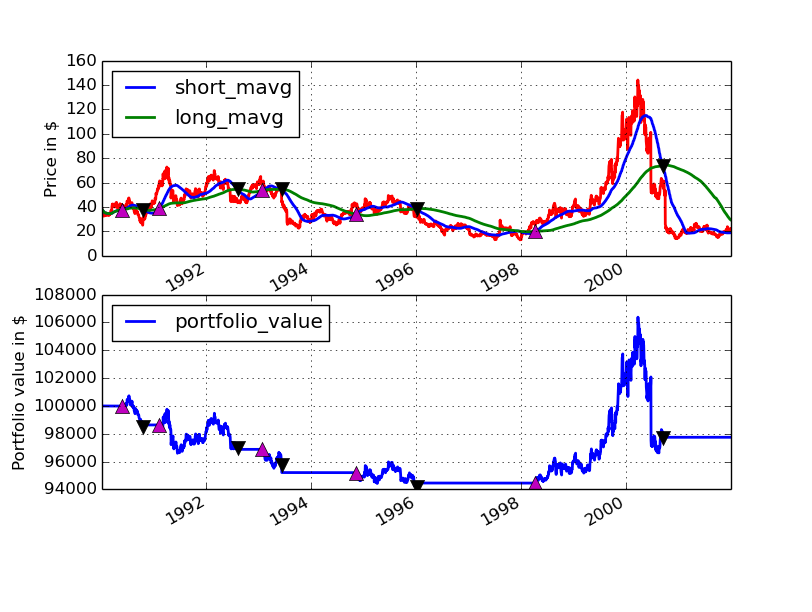
githubでは3つの中で一番星の数が多いライブラリです。使い方の参考として、例題にもあるDMAを使ったアルゴリズムトレードのコードを見てみます。
import pytz
from datetime import datetime
import zipline as zp

start = datetime(1990, 1, 1, 0, 0, 0, 0, pytz.utc)
end = datetime(2002, 1, 1, 0, 0, 0, 0, pytz.utc)
data = zp.utils.factory.load_from_yahoo(stocks=['AAPL'], indexes={}, start=start,
                                        end=end, adjusted=False)

class DualMovingAverage(zp.TradingAlgorithm):
    def initialize(self, short_window=100, long_window=400):
        self.add_transform(zp.transforms.MovingAverage, 'short_mavg', ['price'],
                           window_length=short_window)

        self.add_transform(zp.transforms.MovingAverage, 'long_mavg', ['price'],
                           window_length=long_window)
        self.invested = False

    def handle_data(self, data):
        short_mavg = data['AAPL'].short_mavg['price']
        long_mavg = data['AAPL'].long_mavg['price']
        buy = False
        sell = False

        if short_mavg > long_mavg and not self.invested:
            self.order('AAPL', 100)
            self.invested = True
            buy = True
        elif short_mavg < long_mavg and self.invested:
            self.order('AAPL', -100)
            self.invested = False
            sell = True

        self.record(short_mavg=short_mavg,
                    long_mavg=long_mavg,
                    buy=buy,
                    sell=sell)


import matplotlib.pyplot as plt
dma = DualMovingAverage()
perf = dma.run(data)
fig = plt.figure()
ax1 = fig.add_subplot(211,  ylabel='Price in $')
data['AAPL'].plot(ax=ax1, color='r', lw=2.)
perf[['short_mavg', 'long_mavg']].plot(ax=ax1, lw=2.)

ax1.plot(perf.ix[perf.buy].index, perf.short_mavg[perf.buy],
         '^', markersize=10, color='m')
ax1.plot(perf.ix[perf.sell].index, perf.short_mavg[perf.sell],
         'v', markersize=10, color='k')

ax2 = fig.add_subplot(212, ylabel='Portfolio value in $')
perf.portfolio_value.plot(ax=ax2, lw=2.)

ax2.plot(perf.ix[perf.buy].index, perf.portfolio_value[perf.buy],
         '^', markersize=10, color='m')
ax2.plot(perf.ix[perf.sell].index, perf.portfolio_value[perf.sell],
         'v', markersize=10, color='k')

plt.legend(loc=0)
plt.gcf().set_size_inches(14, 10)
plt.show()

コードを見てみますと、株価の履歴データはzp.utils.factory.load_from_yahooという関数を用いて取得しています。これはpandas.DataFrame型で、pandasで取得できる株価データと同じ構造になっています。
アルゴリズムのメイン部分はzp.TradingAlgorithmクラスを継承することで作成されます。handle_data関数の中で、株価の時間毎に行う処理を記述して、record関数に値を代入していくことで、結果のグラフ化等の際に必要なデータが取り出せるようになっています。
テクニカル指標についてはzipline自身もいくつか指標の計算関数を持っていますが、ta-libをインストールすることで、さらに様々な指標が使用できるようになります。
PyAlgoTrade
ziplineと使い方は似たような感じですが、ビットコインのライブトレードやtwitterのイベントを扱えたりするようです。
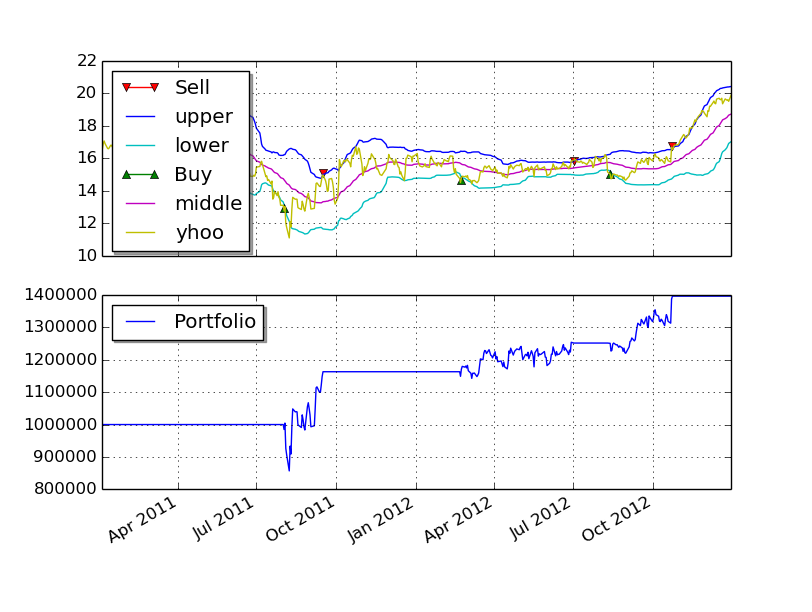
こちらもsamplesにあるBBandsを用いたアルゴリズムトレードのコードを見てみます。
from pyalgotrade import strategy
from pyalgotrade import plotter
from pyalgotrade.tools import yahoofinance
from pyalgotrade.technical import bollinger
from pyalgotrade.stratanalyzer import sharpe


class BBands(strategy.BacktestingStrategy):
    def __init__(self, feed, instrument, bBandsPeriod):
        strategy.BacktestingStrategy.__init__(self, feed)
        self.__instrument = instrument
        self.__bbands = bollinger.BollingerBands(feed[instrument].getCloseDataSeries(), bBandsPeriod, 2)

    def getBollingerBands(self):
        return self.__bbands

    def onBars(self, bars):
        lower = self.__bbands.getLowerBand()[-1]
        upper = self.__bbands.getUpperBand()[-1]
        if lower is None:
            return

        shares = self.getBroker().getShares(self.__instrument)
        bar = bars[self.__instrument]
        if shares == 0 and bar.getClose() < lower:
            sharesToBuy = int(self.getBroker().getCash(False) / bar.getClose())
            self.marketOrder(self.__instrument, sharesToBuy)
        elif shares > 0 and bar.getClose() > upper:
            self.marketOrder(self.__instrument, -1*shares)


def main(plot):
    instrument = "yhoo"
    bBandsPeriod = 40

    # Download the bars.
    feed = yahoofinance.build_feed([instrument], 2011, 2012, ".")

    strat = BBands(feed, instrument, bBandsPeriod)
    sharpeRatioAnalyzer = sharpe.SharpeRatio()
    strat.attachAnalyzer(sharpeRatioAnalyzer)

    if plot:
        plt = plotter.StrategyPlotter(strat, True, True, True)
        plt.getInstrumentSubplot(instrument).addDataSeries("upper", strat.getBollingerBands().getUpperBand())
        plt.getInstrumentSubplot(instrument).addDataSeries("middle", strat.getBollingerBands().getMiddleBand())
        plt.getInstrumentSubplot(instrument).addDataSeries("lower", strat.getBollingerBands().getLowerBand())

    strat.run()
    print "Sharpe ratio: %.2f" % sharpeRatioAnalyzer.getSharpeRatio(0.05)

    if plot:
        plt.plot()


if __name__ == "__main__":
    main(True)

ziplineと同じようにstrategy.BacktestingStrategyクラスを継承して、トレードのメイン部分を作ります。ziplineと比較すると、データプロット系の関数がいろいろと用意されいて、そのへんが便利な感じがします。
pybacktest
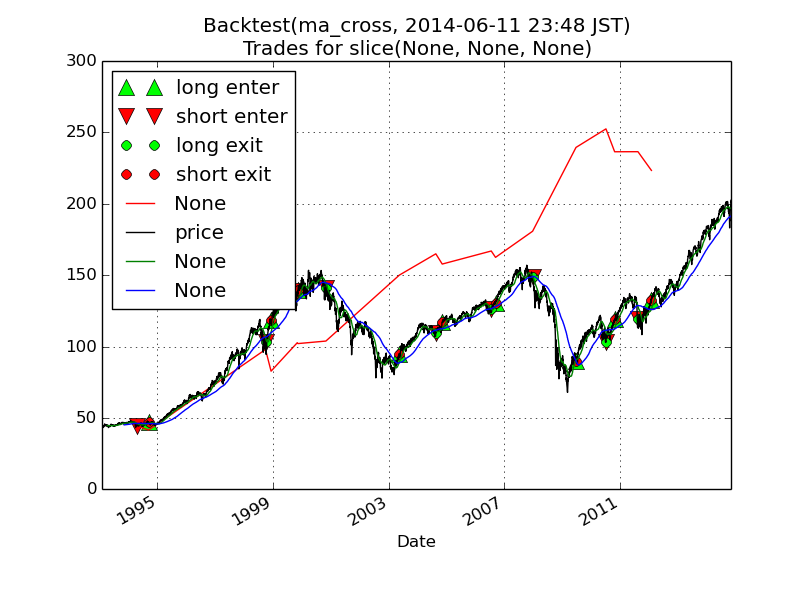
上の2つのライブラリに比べると、軽量なライブラリです。実際の例題コードを見てみます。
import pybacktest
import pandas as pd

ohlc = pybacktest.load_from_yahoo('SPY')
ohlc.tail()

short_ma = 50
long_ma = 200

ms = pd.rolling_mean(ohlc.C, short_ma)
ml = pd.rolling_mean(ohlc.C, long_ma)

buy = cover = (ms > ml) & (ms.shift() < ml.shift())  # ma cross up
sell = short = (ms < ml) & (ms.shift() > ml.shift())  # ma cross down

bt = pybacktest.Backtest(locals(), 'ma_cross')

import pylab
bt.plot_trades()
pd.rolling_mean(ohlc.C, short_ma).plot(c='green')
pd.rolling_mean(ohlc.C, long_ma).plot(c='blue')
pylab.legend(loc='upper left')
pylab.show()

上の2つに比べると、コードが短いのが分かると思います。実際にバックテストを行うクラスがpybacktest.Backtestですが、その前の部分で、あらかじめ買いと売りのシグナルの時系列データを求めています。
テクニカル指標の計算などの機能は用意されてなく、シンプルに機能をまとめたライブラリな感じがします。
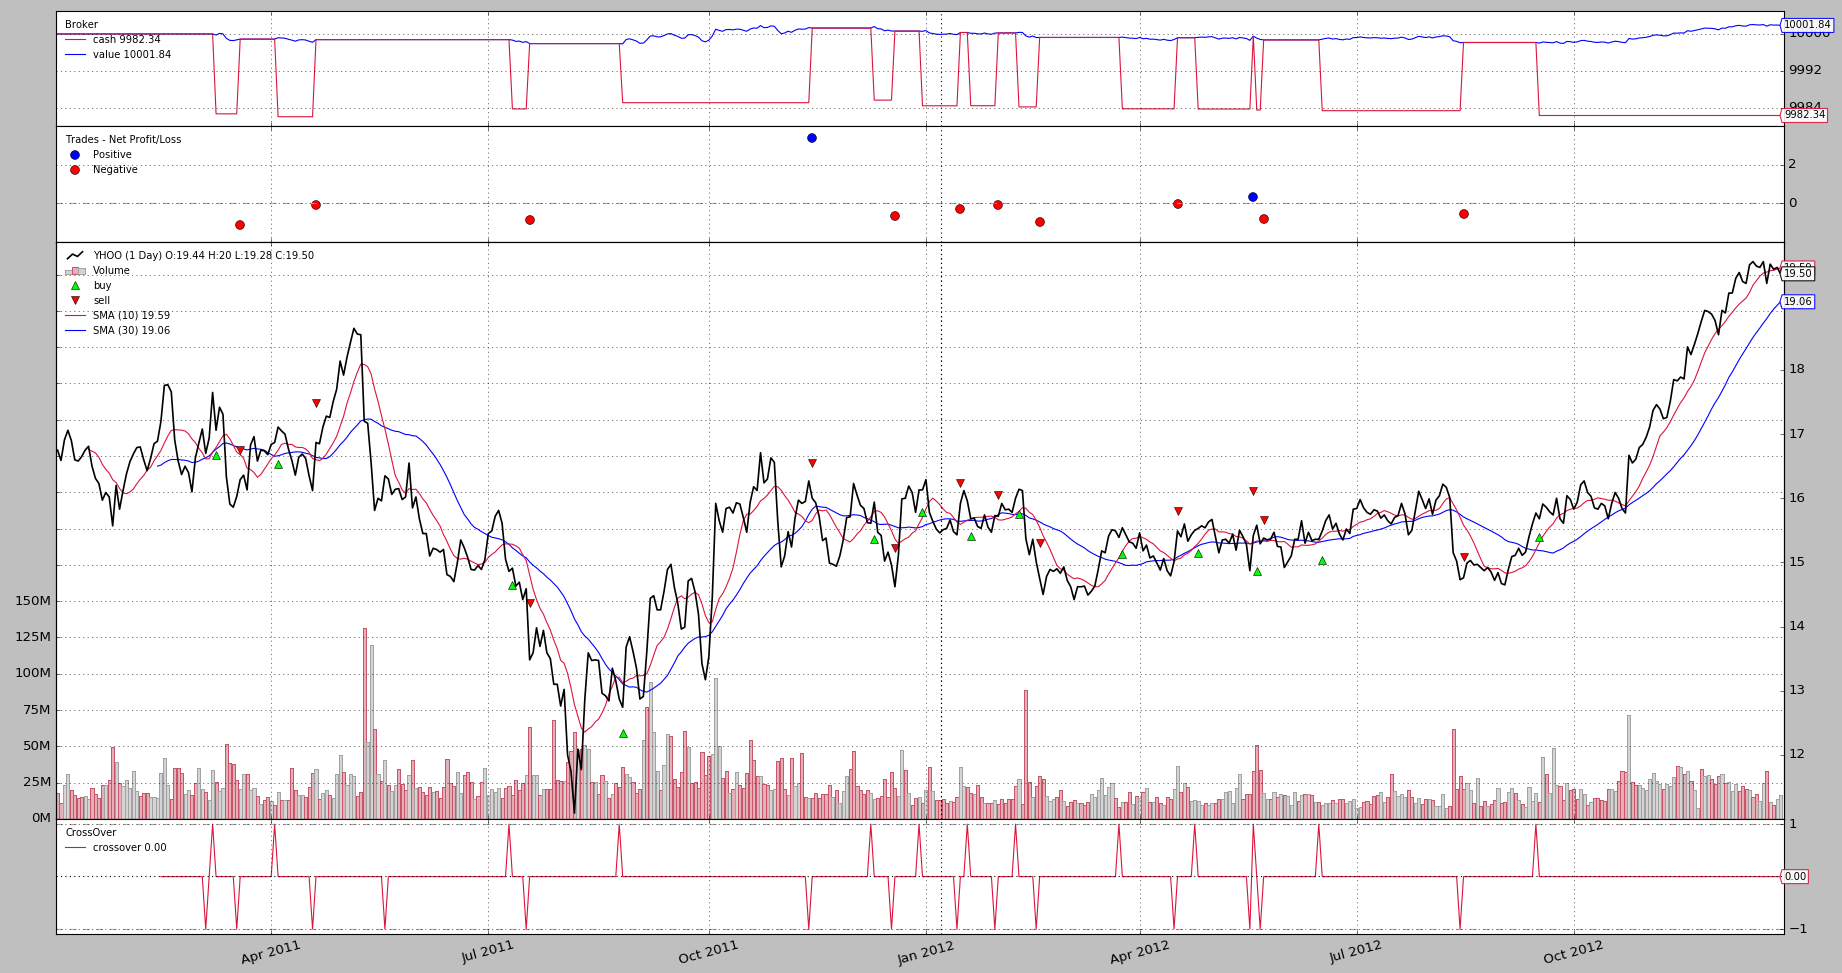
backtrader
from datetime import datetime
import backtrader as bt

class SmaCross(bt.SignalStrategy):
    def __init__(self):
        sma1, sma2 = bt.ind.SMA(period=10), bt.ind.SMA(period=30)
        crossover = bt.ind.CrossOver(sma1, sma2)
        self.signal_add(bt.SIGNAL_LONG, crossover)

cerebro = bt.Cerebro()
cerebro.addstrategy(SmaCross)

data0 = bt.feeds.YahooFinanceData(dataname='YHOO', fromdate=datetime(2011, 1, 1),
                                  todate=datetime(2012, 12, 31))
cerebro.adddata(data0)

cerebro.run()
cerebro.plot()
その他
その他で見つけたpythonのアルゴリズムトレードライブラリです。
ultra-finance
QSTK
