はじめに😋
streamlitハマってます。
クールですね。
そんなクールなstreamlitを、今回は簡単な特徴量エンジニアリングに使ってみました。
👇 kaggleにあるmercariの商品金額リコメンドアルゴリズムのコンペデータをいじってみました。
Mercari Price Suggestion Challenge | https://www.kaggle.com/c/mercari-price-suggestion-challenge
以下のツールを利用します。
データ整形
pandas + streamlit
streamlit | https://www.streamlit.io/
ビジュアライズ ・ 学習
VARISTA
varista | https://www.varista.ai/

とりあえず脳死でぶち込んでみる🤮
列の型も欠損値もパラメータも何も考えずにとりあえず学習にかけられるのがVARISTAのいいところですよね
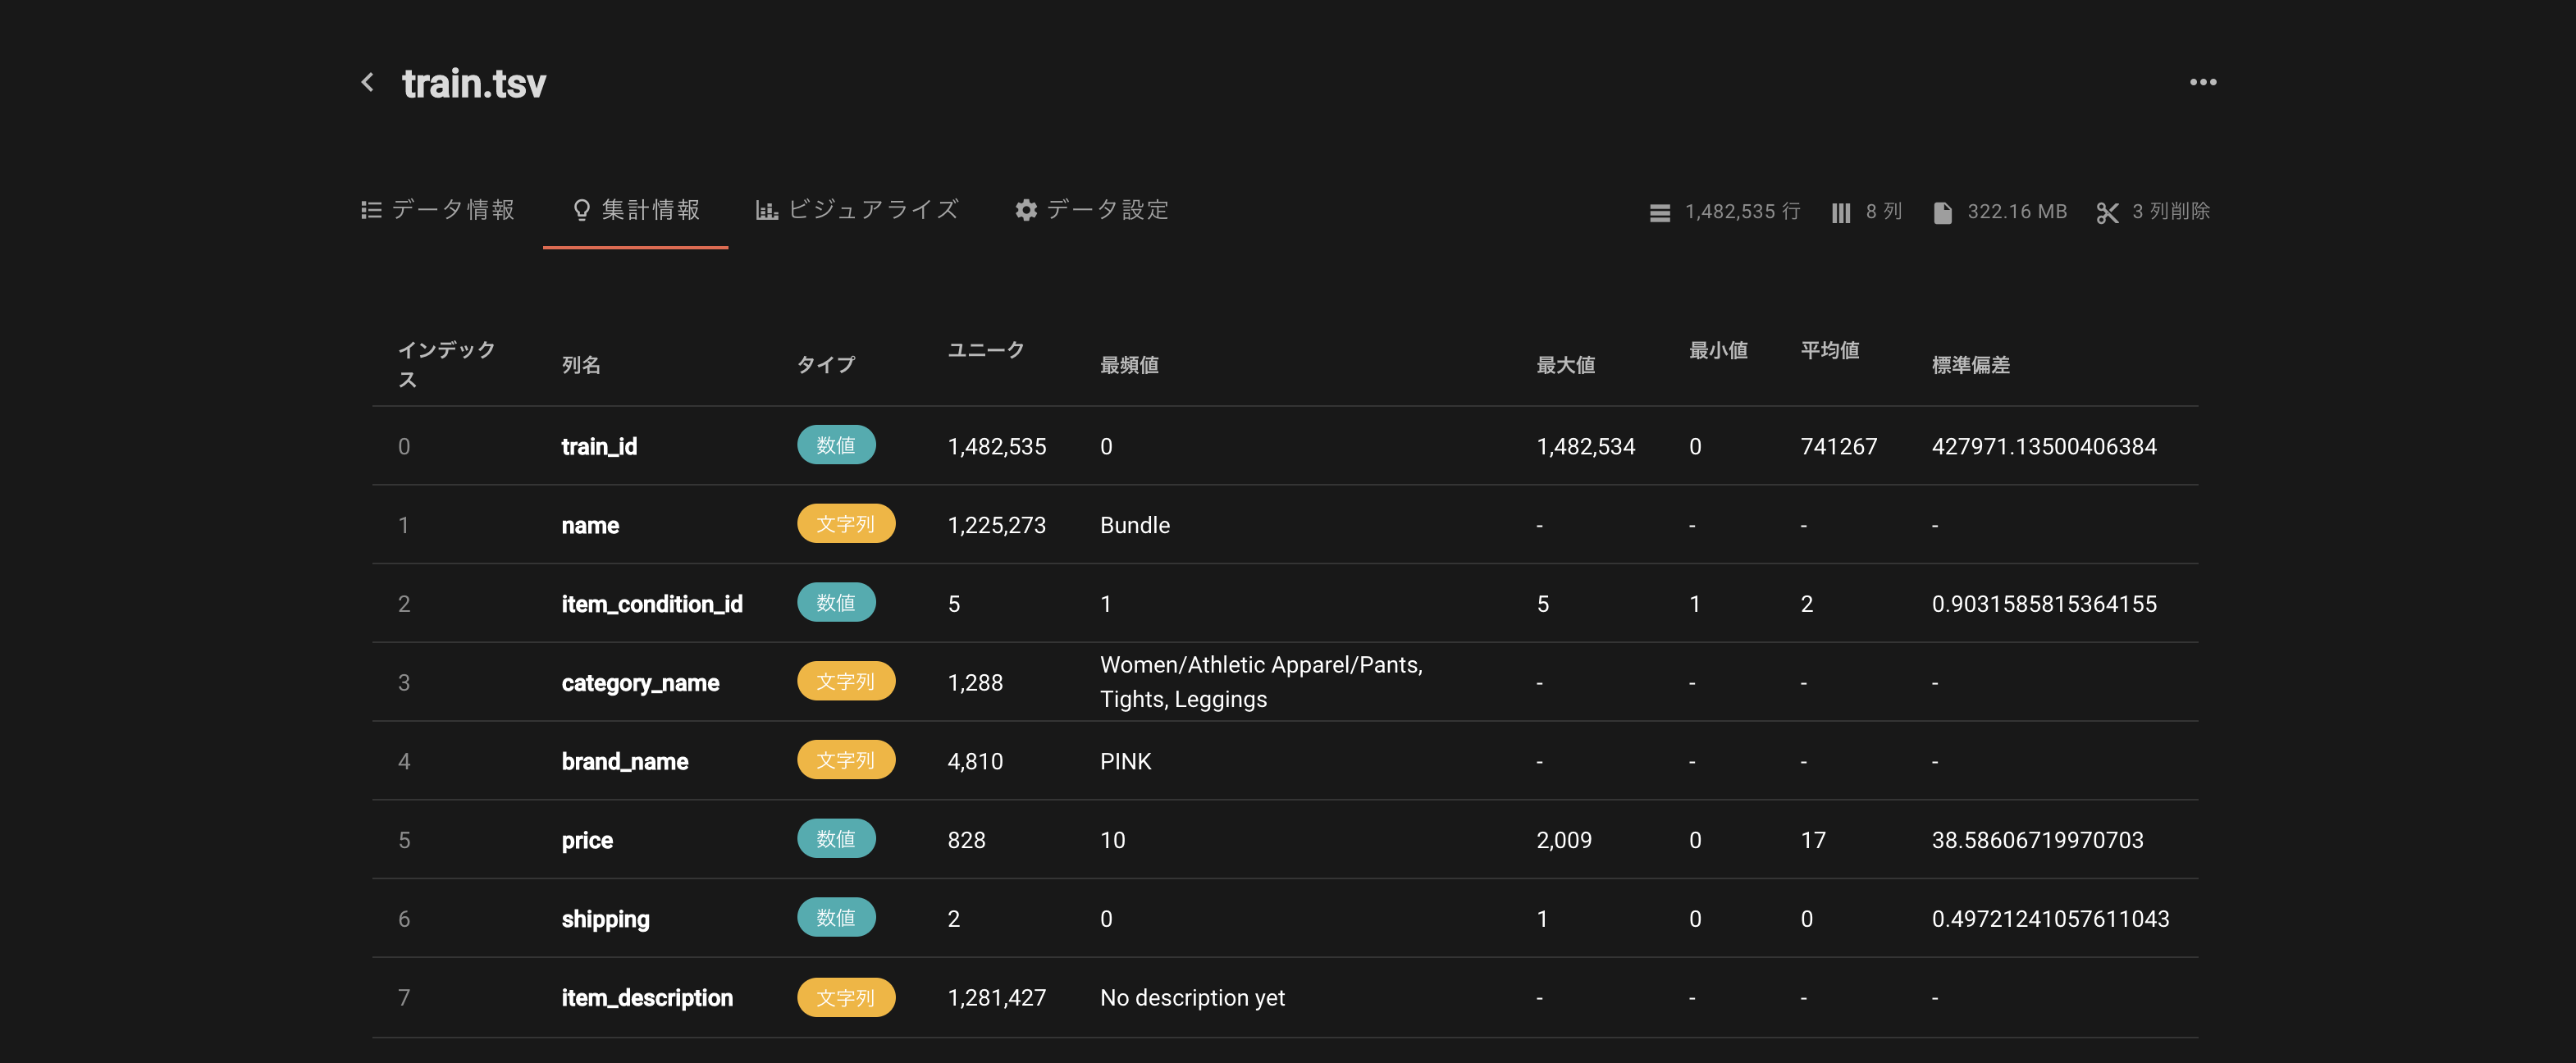
結果はこんな感じです。
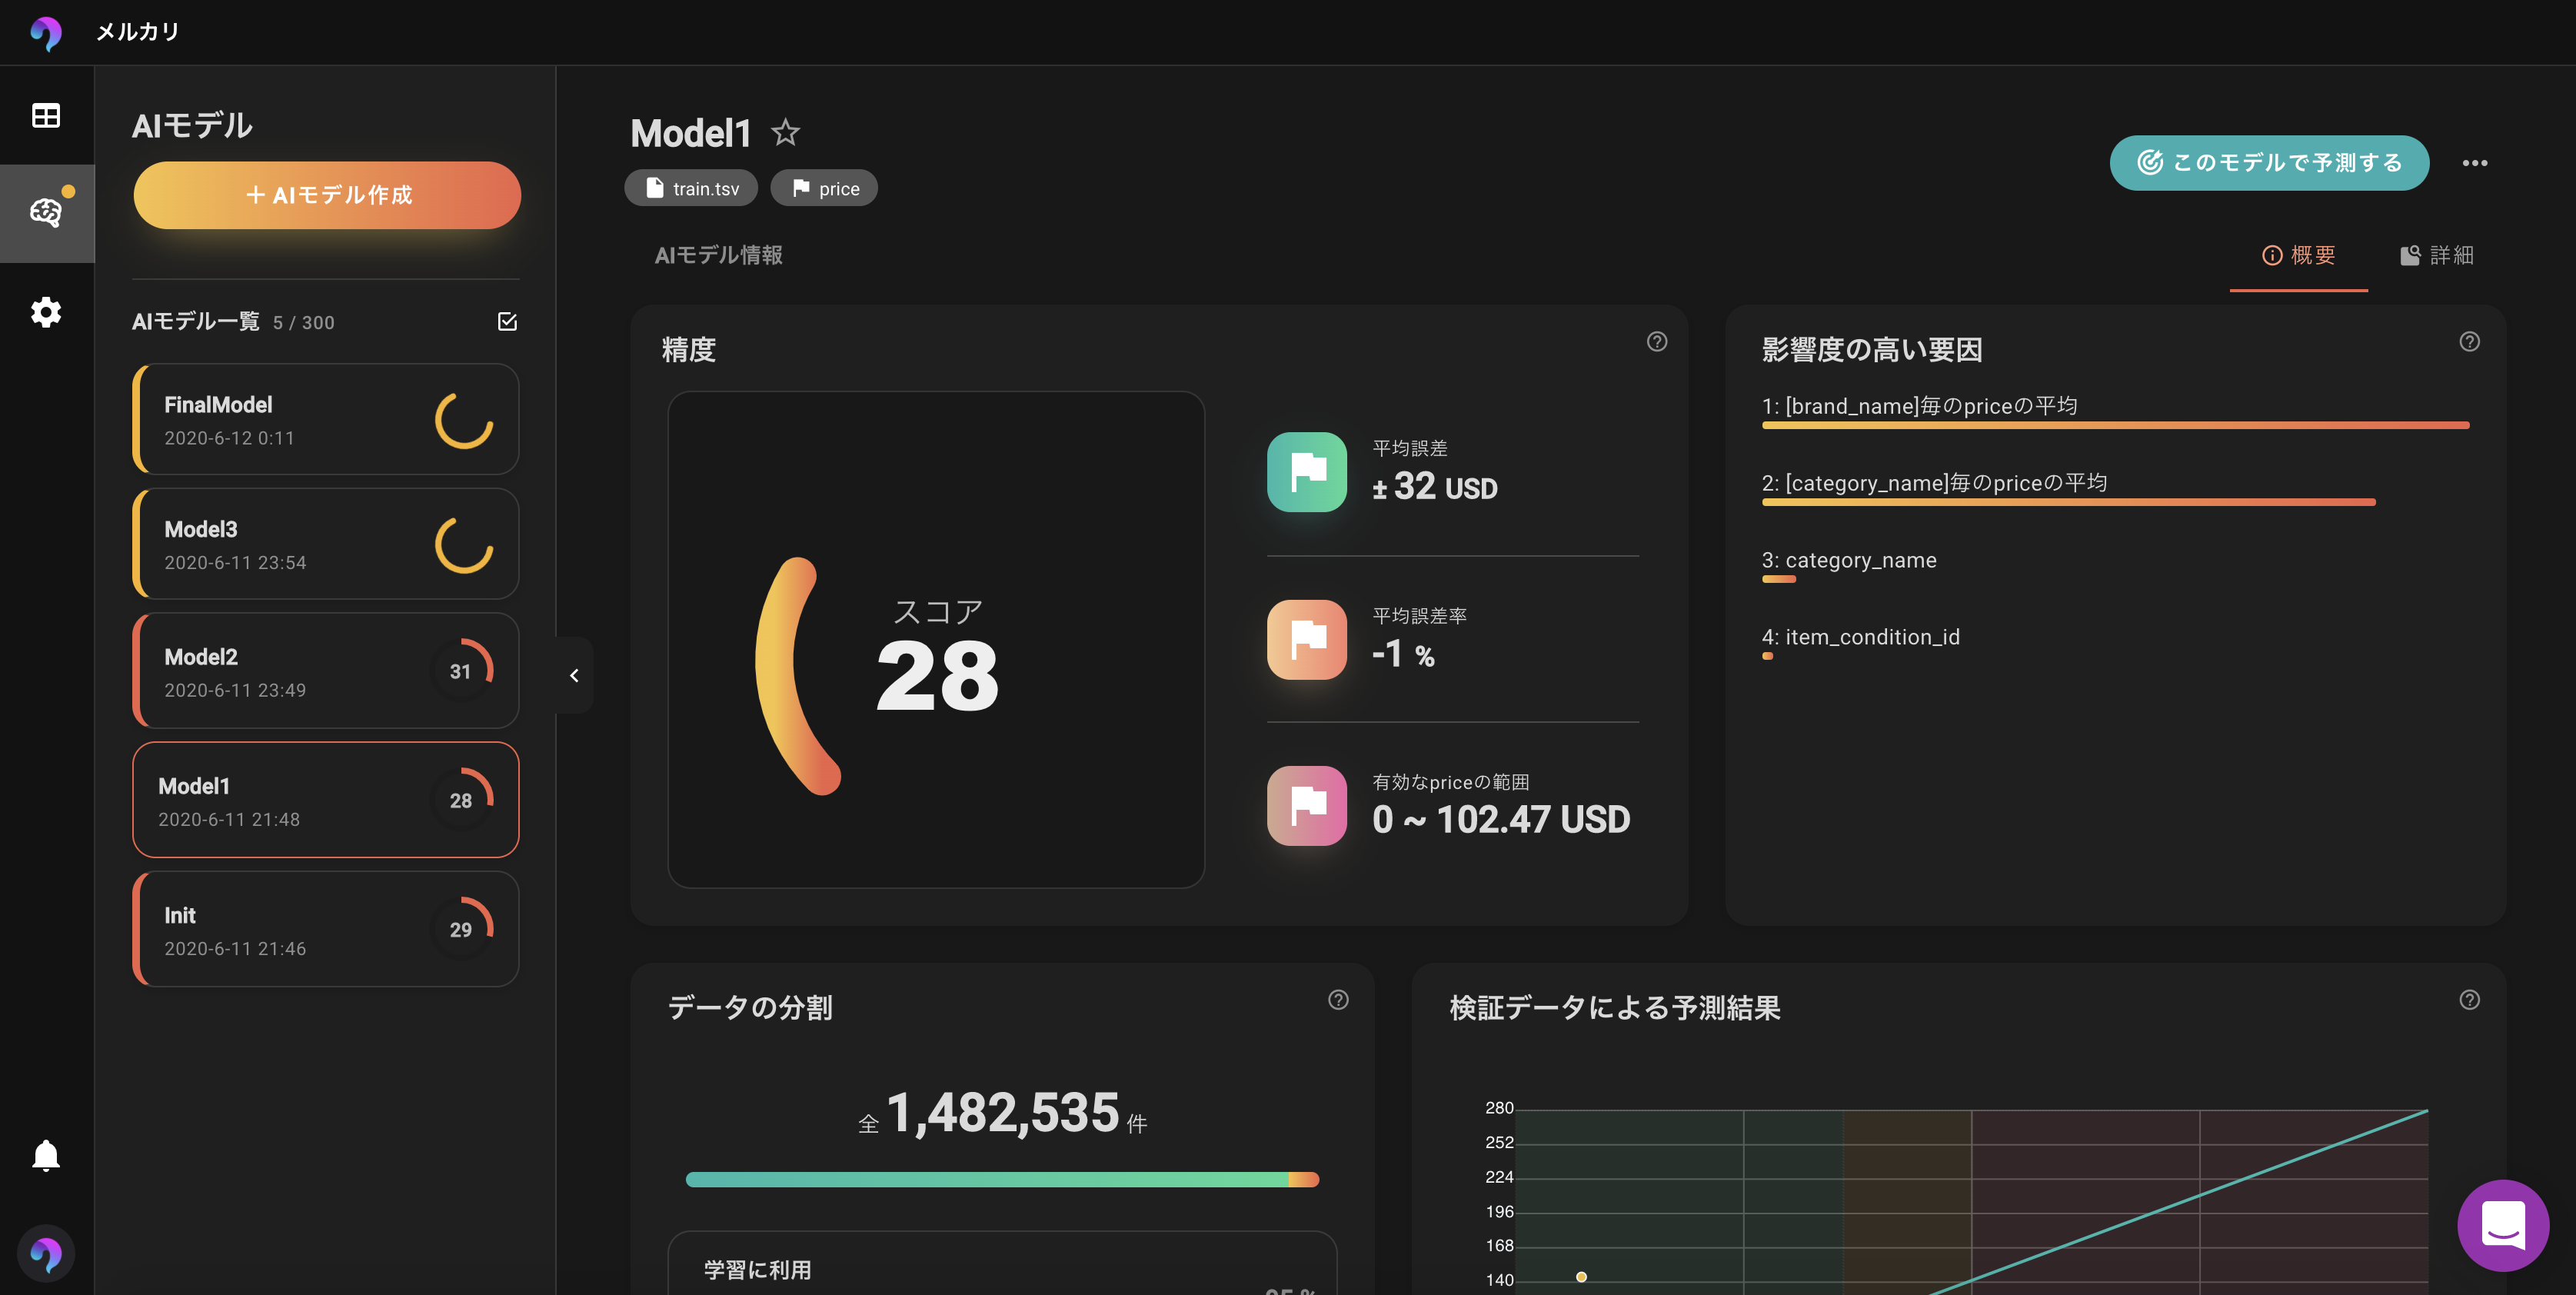
スコアは低いですね。
RMSLEは0.569でした。 リーダーボードでのトップは0.377ほどでしたのでまだまだですね。
特徴をいじってどこまで上げられるかを検証してみます。
ブランド、カテゴリの調整
次の作業を行っていきます。
- 小規模ブランドのカット
- カテゴリーのパース
- 説明文の変換
 #### streamlitをrunします。
データを読み込んで整形していきましょう。
@st.cache
def load_data():
    __df = pd.read_table('/Users/tomoki/Desktop/workspace/AI/varista-data/mercari/train.tsv')
    return __df
小規模ブランドのカット
4809ブランドあるうちの上位2500ブランドのみを残し、他はノンブランドとして扱います。
@st.cache
def brand_cutting(df):
    NUM_BRANDS = 2500
    pop_brand = df['brand_name'].value_counts().index[:NUM_BRANDS]
    df.loc[~df['brand_name'].isin(pop_brand), 'brand_name'] = 'NO_BRAND'
    df['is_no_brand'] = 0
    return df

カテゴリーのパース
カテゴリは'Men/Tops/T-shirts'のように3つの小カテゴリーから構成されているため、splitしましょう。
@st.cache
def parse_category(df):
    df['first_category'] = df['category_name'].str.split(pat="/", expand=True)[0]
    df['second_category'] = df['category_name'].str.split(pat="/", expand=True)[1]
    df['third_category'] = df['category_name'].str.split(pat="/", expand=True)[2]
    return df

説明文の変換
以下の二つの特徴を追加します。
- 説明欄が空かどうかのフラグ
- 説明の文字数
@st.cache
def description_enc(df):
    df['is_desc_empty'] = 0
    df.loc[df['item_description'] == 'No description yet', 'is_desc_empty'] = 1
    df['desc_length'] = df['item_description'].str.len()
    df.loc[df['is_desc_empty'] == 1, 'desc_length'] = 0
    return df

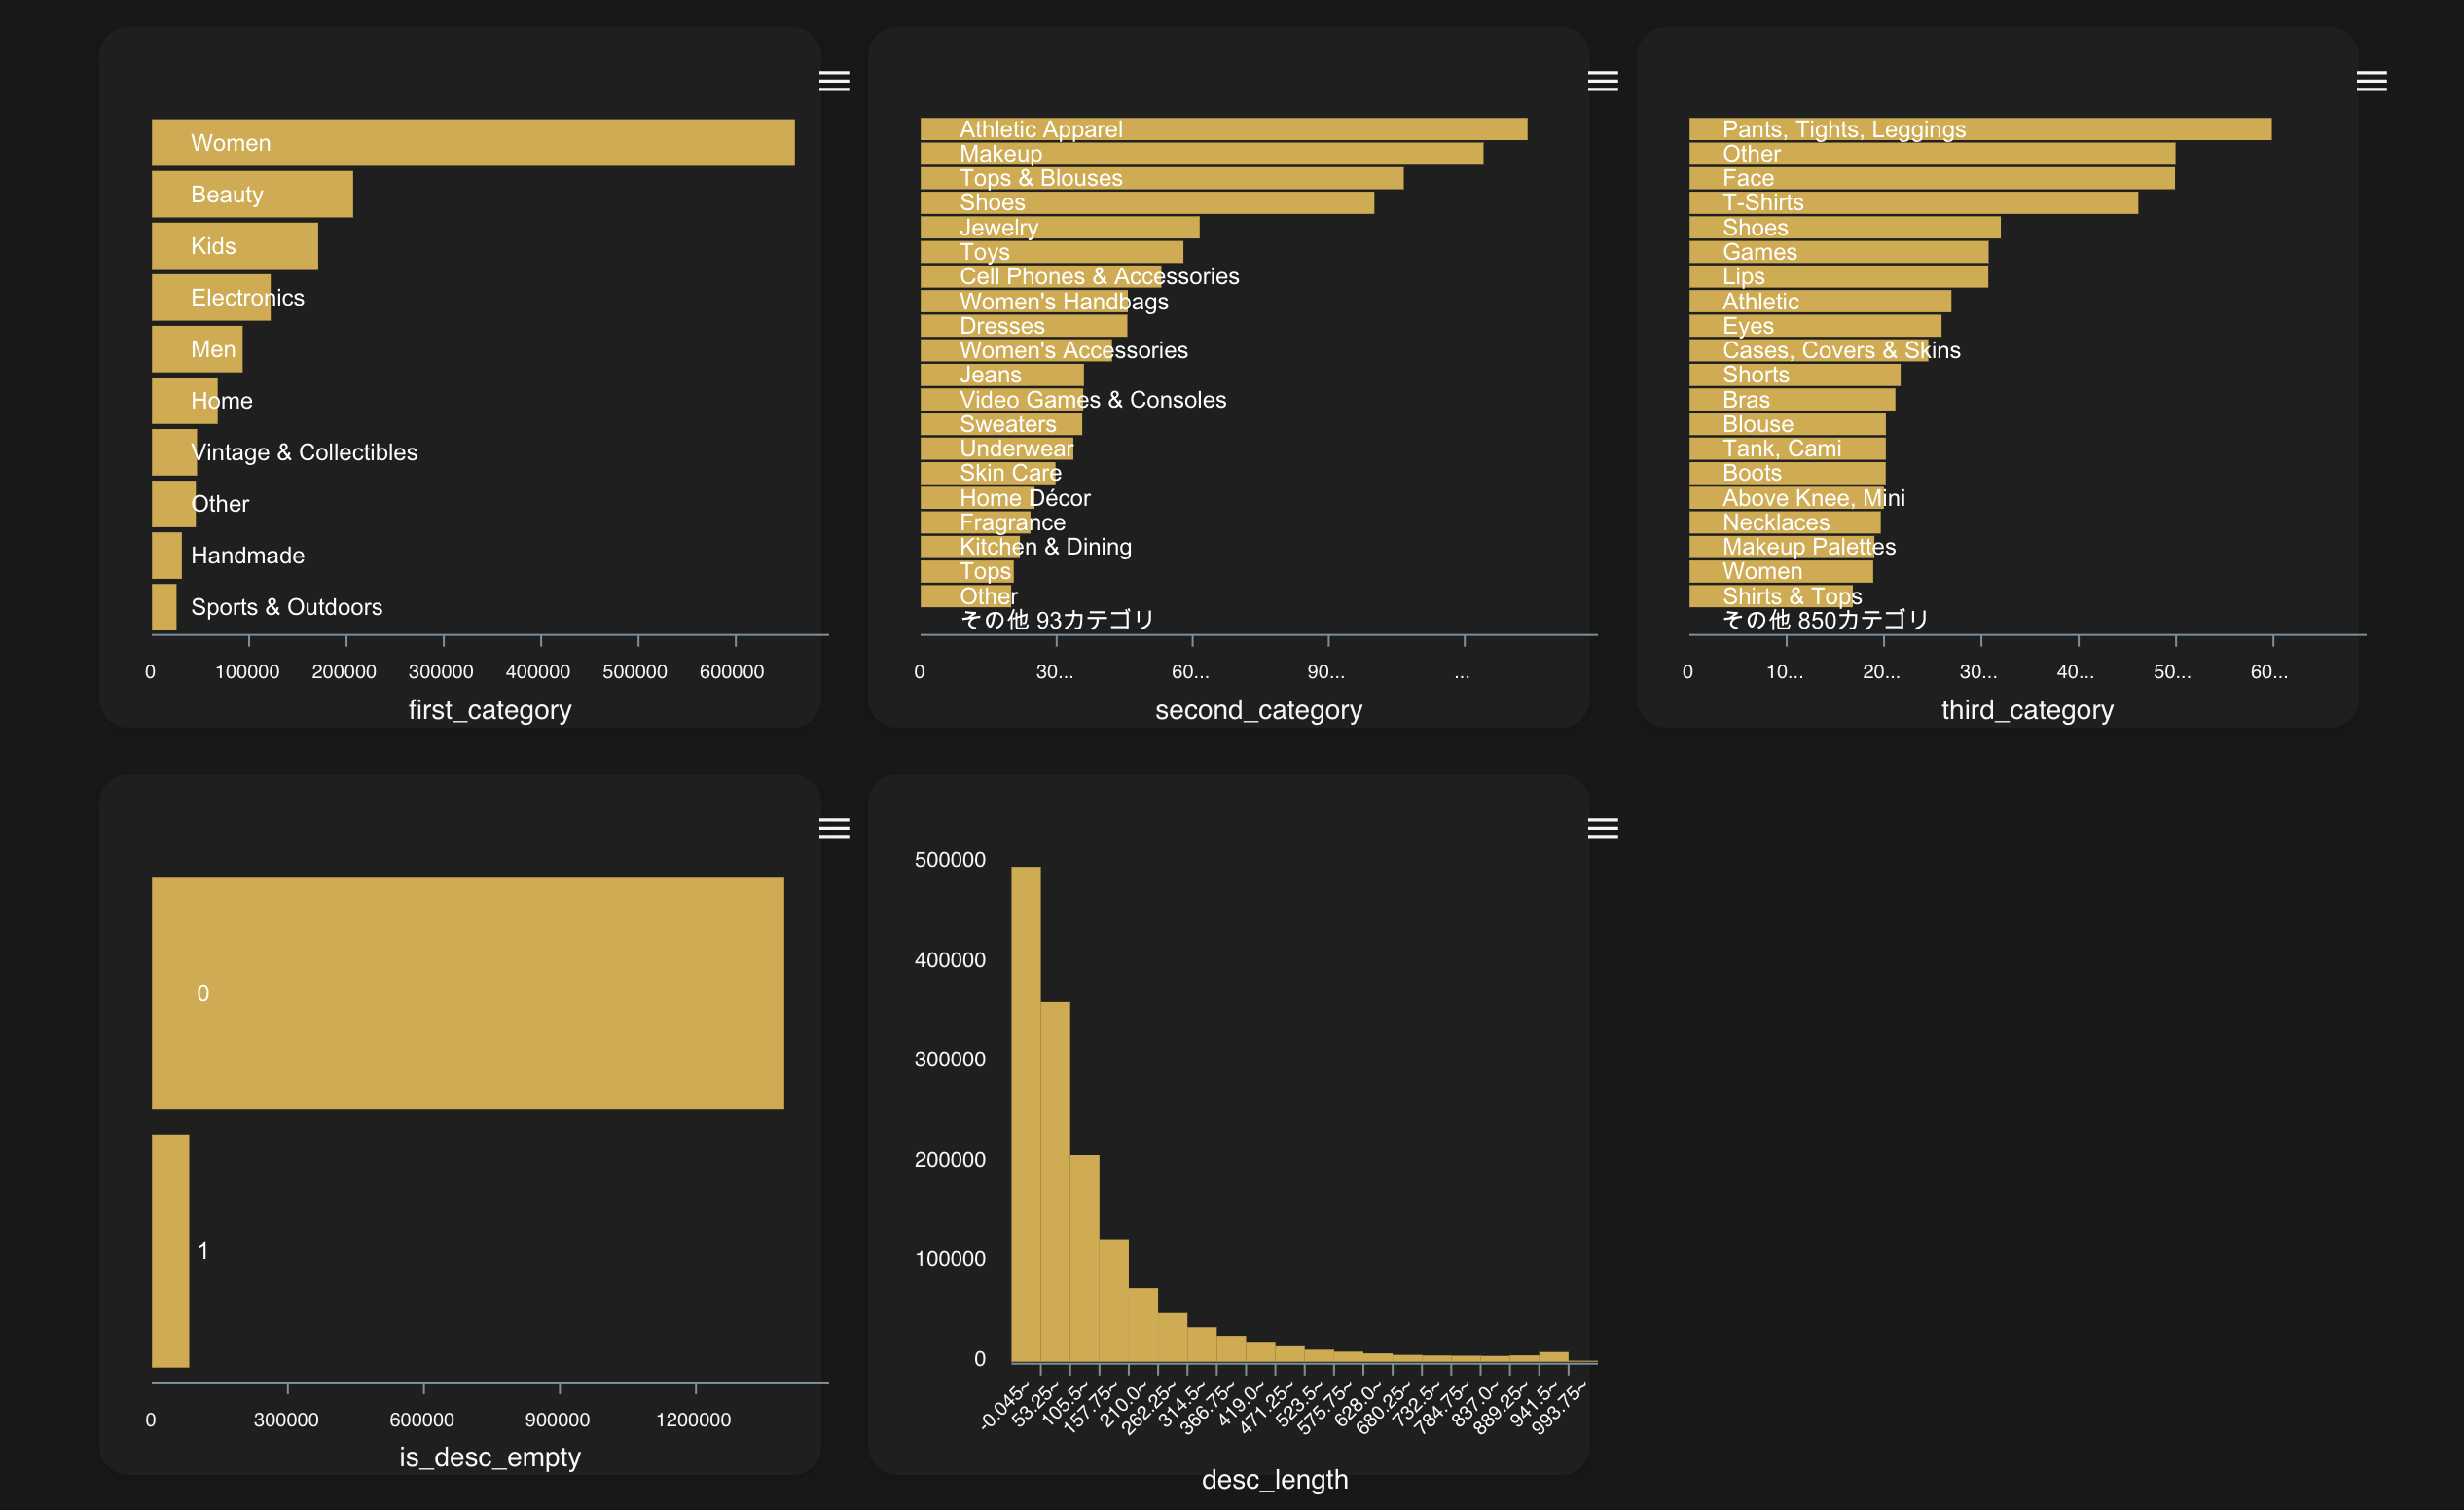
 できたデータをみてみましょう。
調整後のデータ確認
学習結果🎉
学習結果を見てみましょう 👀
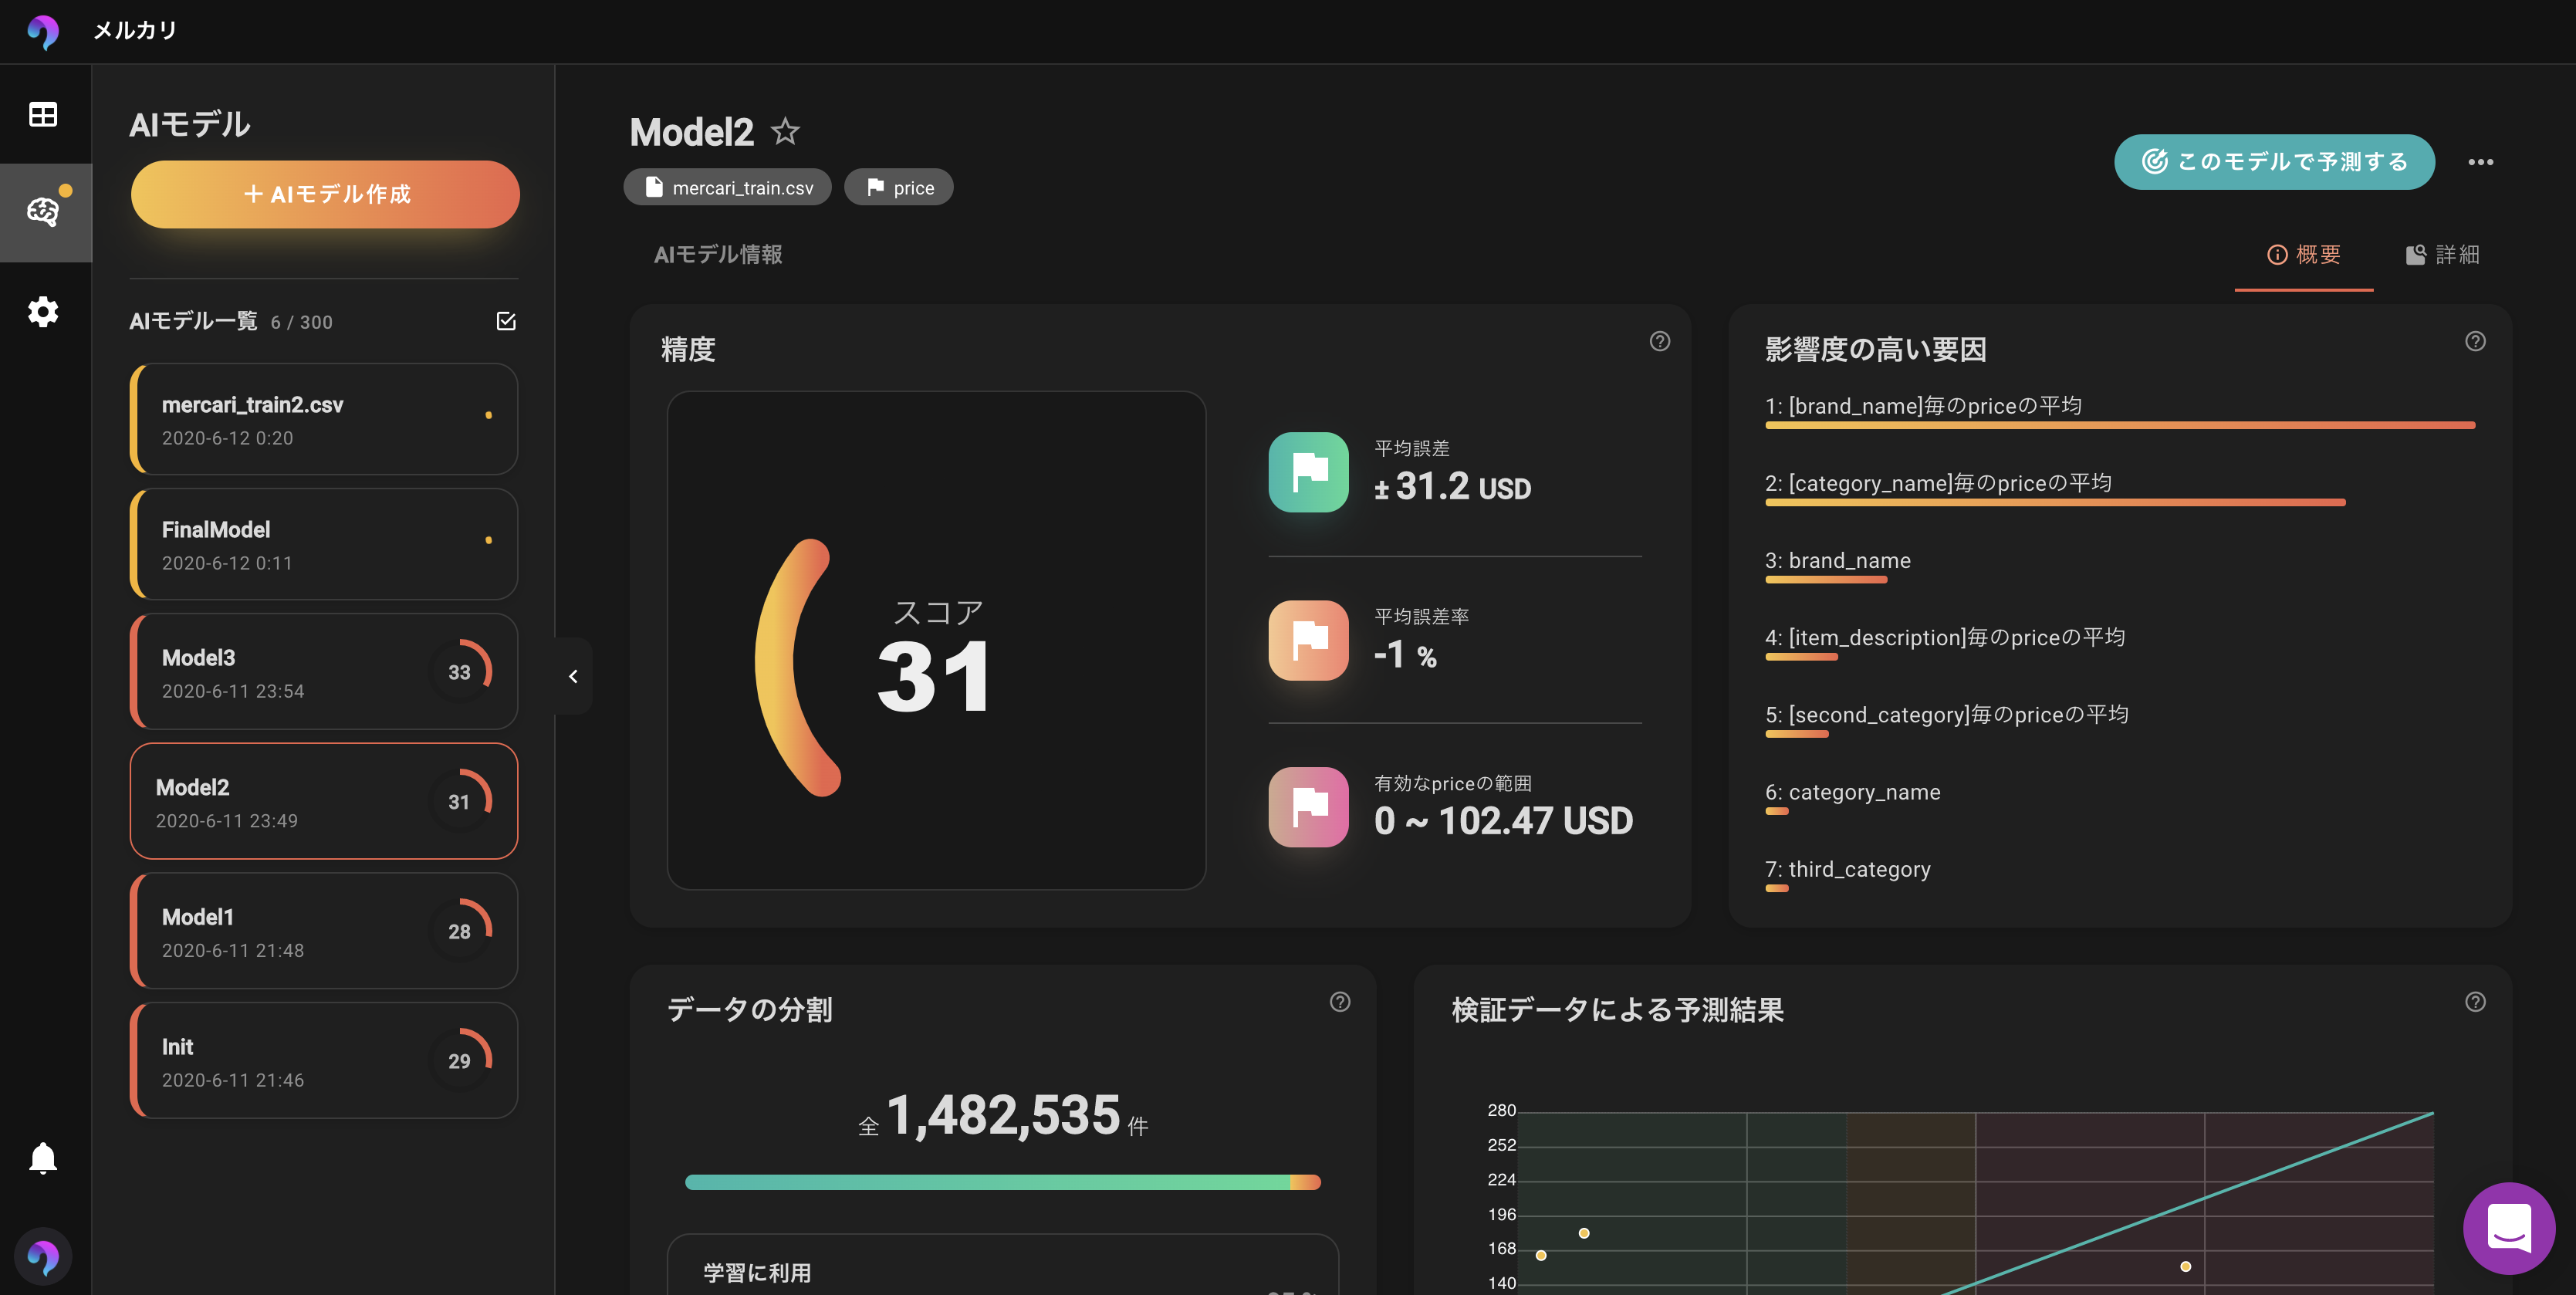
スコアが33に上がりました!
詳細を比較してみます。
【Before】

【After】

ターゲットのRMSLEが0.01改善されましたね。
これをすこしでもよくしていくためにkagglerの人たちは、血と涙を流して戦っているんですねー。
さらに改良
昔バイトでリサイクルショップに務めていた経験を活かし、次なる試作を考えました。
ブランドとカテゴリの組み合わせが値段に関係してくるのではないかと思ったわけです。
「Nike」っていうブランドだけだと、金額は予想できません
「スニーカー」ってだけでも難しいです。
ところが「Nikeのスニーカー」だと想像しやすくないですか??
ということで列を追加します。
@st.cache
def brand_cat_enc(df):
    df['brand*cat1'] = df['brand_name'] + '_' + df['first_category']
    df['brand*cat2'] = df['brand_name'] + '_' + df['second_category']
    df['brand*cat3'] = df['brand_name'] + '_' + df['third_category']
    return df

「ノーブランドジュエリー」、「ノーブランド携帯アクセサリ」いい感じな気がします。
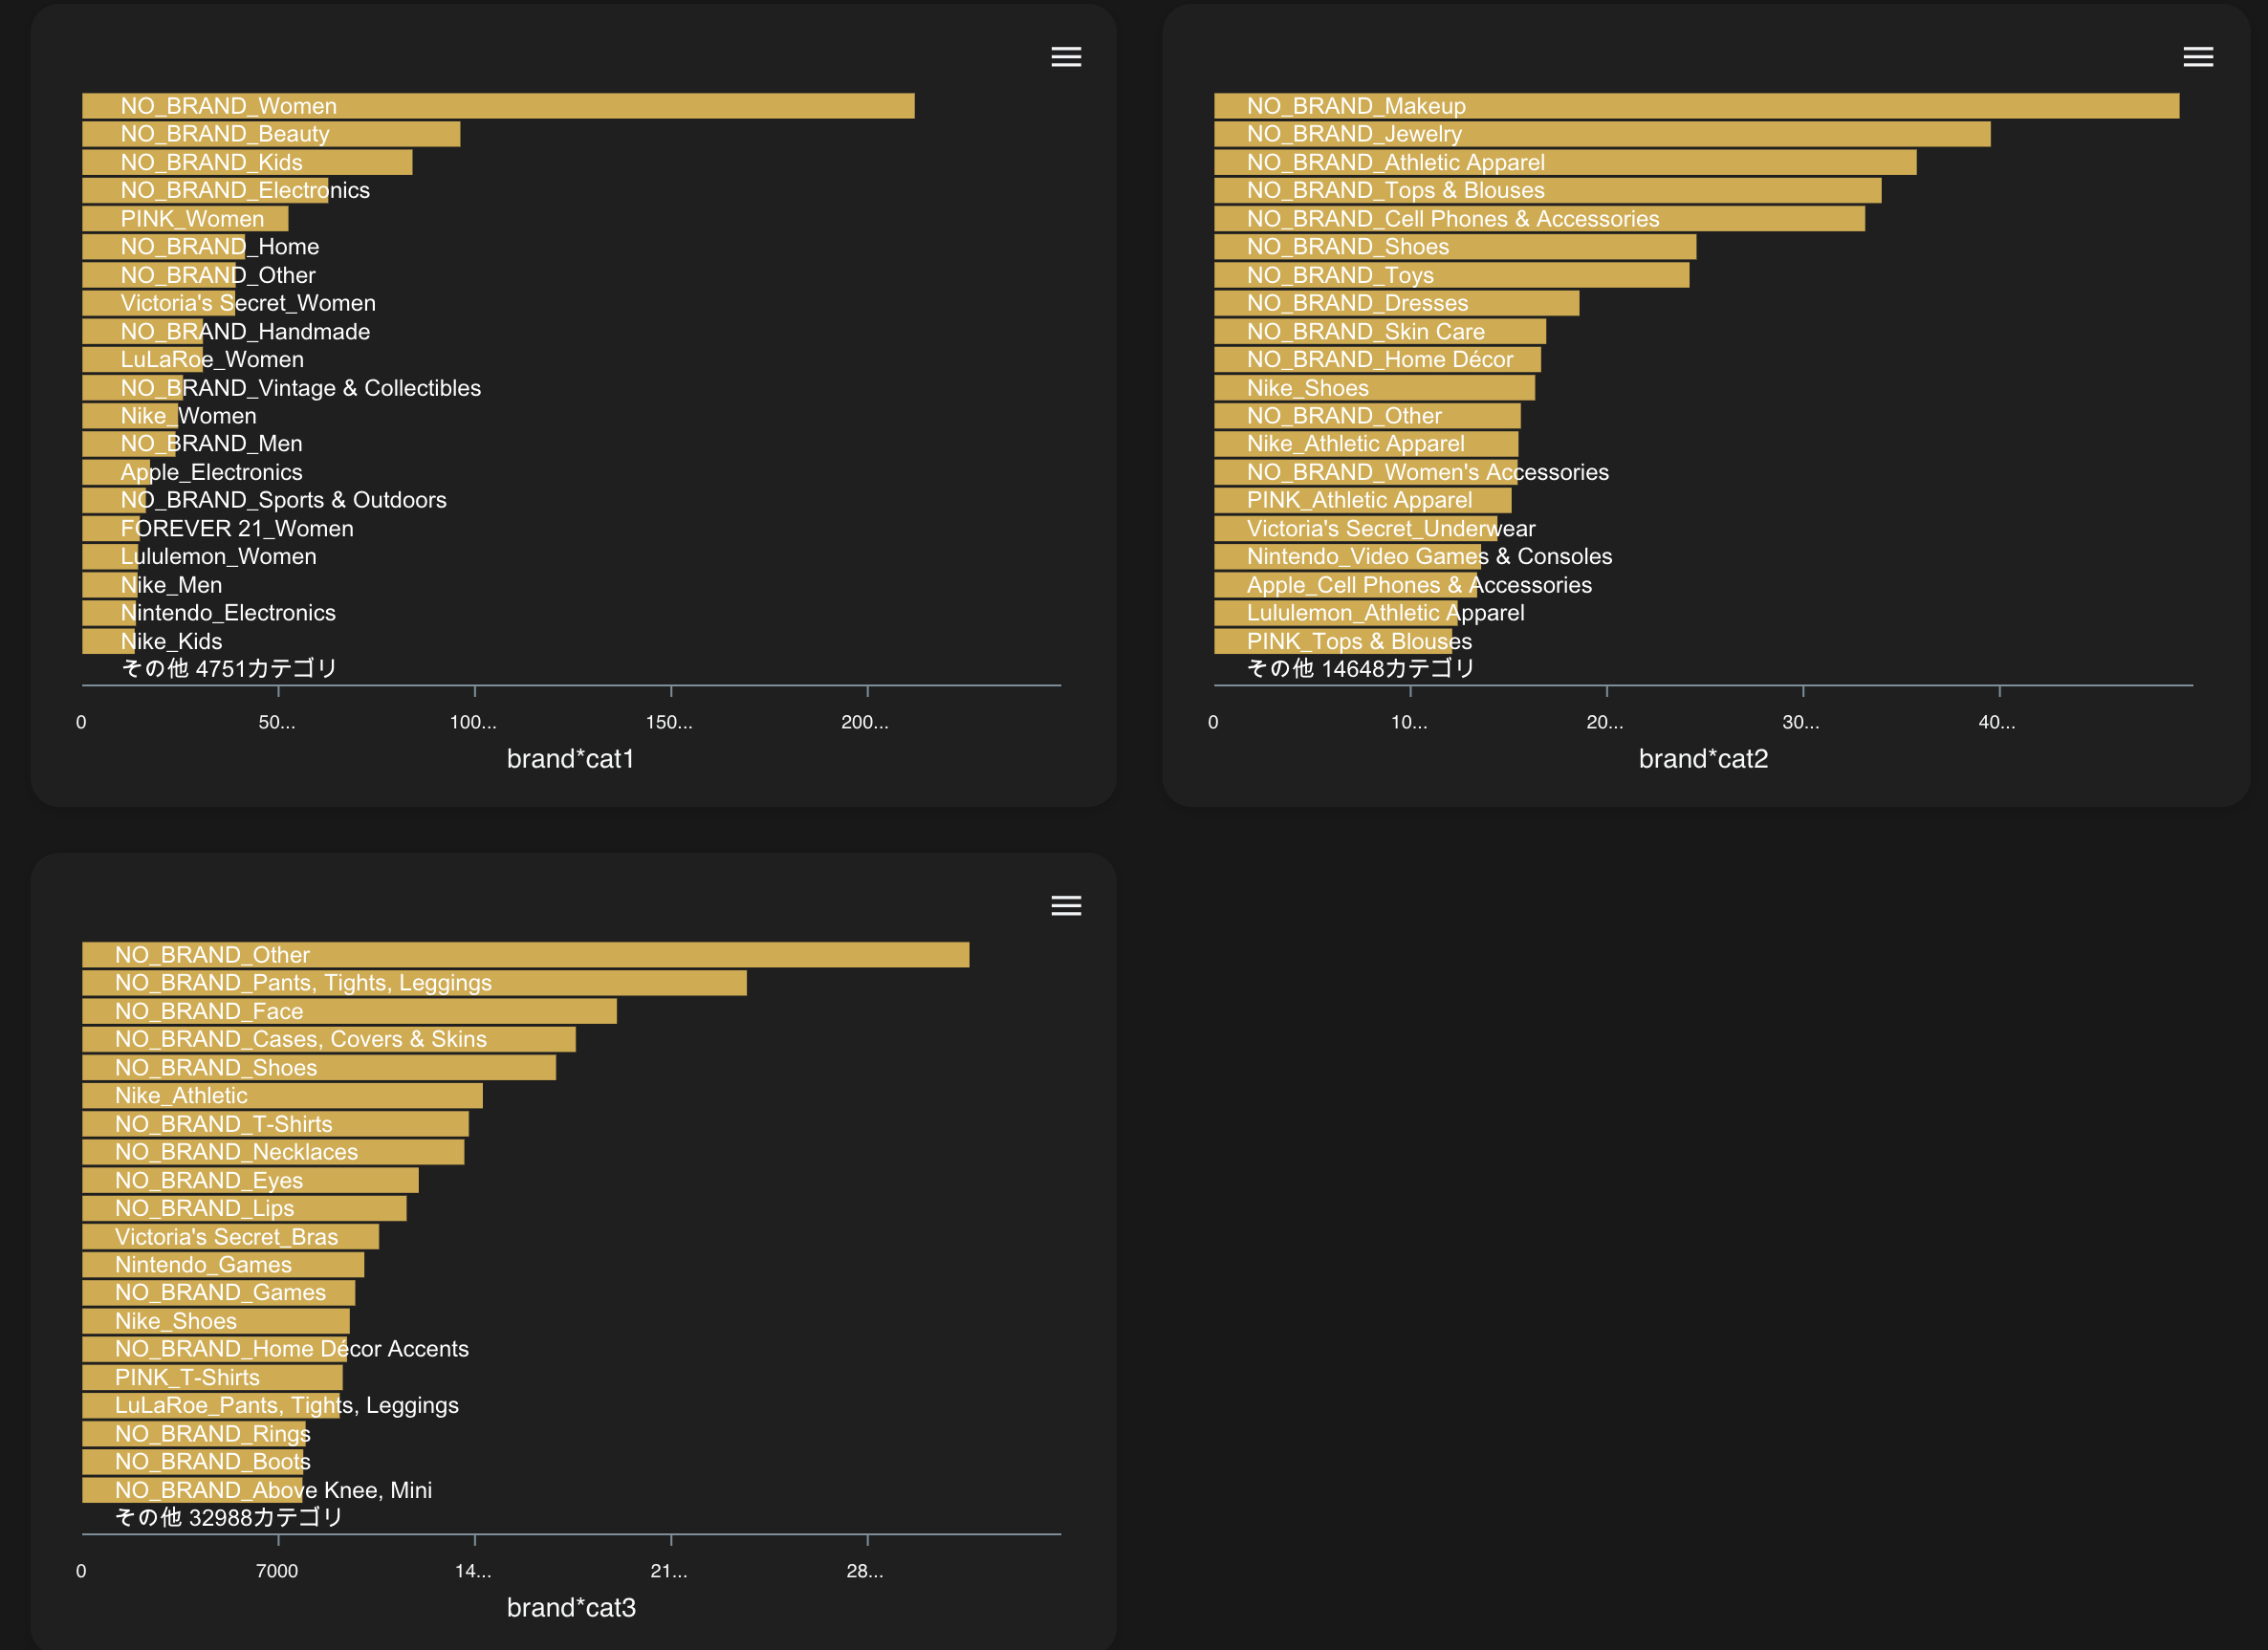
改めて学習させてみましょう。
学習結果🎉
 **わずかですがさらにスコアが上昇しました!**
注目すべきはFeatureImportanceですね。
 **「ブランド*カテゴリ3」毎の平均価格**が大きく影響してることがわかります。
追加した甲斐がありました。
【Before】
 【After】
 **0.569 -> 0.541**までRMSLEが改善されてます。
おわり✋
検証スコアではありますがリーダーボードではこの辺りです。

まだまだトップには及ばないので、カーネルでいろんな情報を得て、改善していこうと思います。
コード全体✒️
import pandas as pd
import numpy as np
import streamlit as st


@st.cache
def load_data():
    __df = pd.read_table('/Users/tomoki/Desktop/workspace/AI/varista-data/mercari/train.tsv')
    return __df

@st.cache
def brand_cutting(df):
    NUM_BRANDS = 2500
    pop_brand = df['brand_name'].value_counts().index[:NUM_BRANDS]
    df.loc[~df['brand_name'].isin(pop_brand), 'brand_name'] = 'NO_BRAND'
    df['is_no_brand'] = 0
    return df

@st.cache
def parse_category(df):
    df['first_category'] = df['category_name'].str.split(pat="/", expand=True)[0]
    df['second_category'] = df['category_name'].str.split(pat="/", expand=True)[1]
    df['third_category'] = df['category_name'].str.split(pat="/", expand=True)[2]
    return df

@st.cache
def description_enc(df):
    df['is_desc_empty'] = 0
    df.loc[df['item_description'] == 'No description yet', 'is_desc_empty'] = 1
    df['desc_length'] = df['item_description'].str.len()
    df.loc[df['is_desc_empty'] == 1, 'desc_length'] = 0
    return df

@st.cache
def brand_cat_enc(df):
    df['brand*cat1'] = df['brand_name'] + '_' + df['first_category']
    df['brand*cat2'] = df['brand_name'] + '_' + df['second_category']
    df['brand*cat3'] = df['brand_name'] + '_' + df['third_category']
    return df


def main():
    st.title('Mercari data encoding 🎁')
    __df = load_data().copy()
    st.text(__df.shape)
    st.write(__df.head())

    st.header('Brand cutting ✂️')

    __brand_num = __df['brand_name'].nunique()
    st.subheader('Brand num : {}'.format(__brand_num))
    st.subheader('The top 2,500 brands are the most popular brands.')

    __df = brand_cutting(__df)

    st.text('Pop brand : {}'.format(__df[__df['brand_name'] != 'NO_BRAND'].shape))
    st.write(__df[__df['brand_name'] != 'NO_BRAND'].head())
    st.text('No brand: {}'.format(__df[__df['brand_name'] == 'NO_BRAND'].shape))
    st.write(__df[__df['brand_name'] == 'NO_BRAND'].head())


    st.header('Parse category 🍕')
    __df = parse_category(__df)

    st.subheader('First category : {}cat'.format(__df['first_category'].nunique()))
    st.write(__df['first_category'].value_counts().head())

    st.subheader('Second category : {}cat'.format(__df['second_category'].nunique()))
    st.write(__df['second_category'].value_counts().head())

    st.subheader('Third category : {}cat'.format(__df['third_category'].nunique()))
    st.write(__df['third_category'].value_counts().head())

    st.header('Description encoding ⚡️')
    st.subheader('Empty flag')

    __df = description_enc(__df)

    st.text('Description empty: {}'.format(__df[__df['is_desc_empty'] == 1].shape))
    st.write(__df[__df['is_desc_empty'] == 1].head())
    st.subheader('Description length (If the description is blank, 0)')
    hist = pd.cut(__df['desc_length'], 24, duplicates='drop').value_counts(sort=False)
    st.text(list(hist.index))
    st.bar_chart(list(hist.values))

    st.header('Brand * Category')
    __df = brand_cat_enc(__df)
    st.subheader('Brand * First Categiry')
    st.write(__df['brand*cat1'].value_counts().head())
    st.subheader('Brand * Second Categiry')
    st.write(__df['brand*cat2'].value_counts().head())
    st.subheader('Brand * Third Categiry')
    st.write(__df['brand*cat3'].value_counts().head())


    __df.to_csv('mercari_train.csv', index=False)
    st.header('Save mercari_train.csv 🎉')


if __name__ == "__main__":
    main()

