1
1

Delete article

Deleted articles cannot be recovered.

Draft of this article would be also deleted.

Are you sure you want to delete this article?

More than 5 years have passed since last update.

Cognos レポートでリストのセルに棒グラフを表示するお手軽なやり方

Last updated at Posted at 2017-04-25

概要

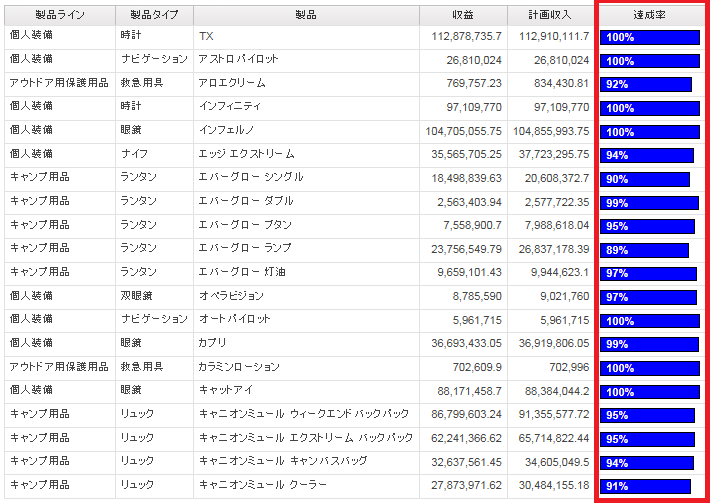
こんな感じに、リストの列を棒グラフで表示したい時のお手軽なやり方です。
001.PNG

実装方法

Report Authoring では、以下のようにリストにアイテムを置いています。
002.PNG

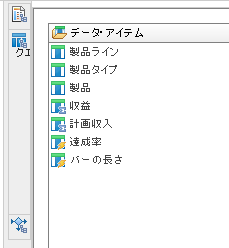
リストのクエリーは以下です。
003.PNG

※「達成率」のデータアイテムの中身
([収益]/[計画収入])

※「バーの長さ」のデータアイテムの中身
_round(([収益]/[計画収入])*10,1)*10

・1つ目のHTML Item
実際の記述:

・2つ目のHTML Item
ソースのタイプを「データアイテムの値」、データ・アイテムの値を「バーの長さ」にしています。
005.PNG

・3つ目のHTML Item
実際の記述:
">
006.PNG

・4つ目のHTML Item
実際の記述:
</div>
007.PNG

適当に、1つ目のHTML Itemの記載を変えればカスタマイズできますので、ご活用下さい。

1
1
0

Register as a new user and use Qiita more conveniently

  1. You get articles that match your needs
  2. You can efficiently read back useful information
  3. You can use dark theme
What you can do with signing up
1
1

Delete article

Deleted articles cannot be recovered.

Draft of this article would be also deleted.

Are you sure you want to delete this article?