今回は,Quantopian Research を使って,株式市場の雰囲気をつかむ指標を書いてみたいと思います.
HighLowRatio とは
今日の価格が,過去一年で高値だった銘柄数と安値だった銘柄数の比率です.
HighLowRatioの,
- 数値が100%に近ければ、市場がイケイケドンドン\(^o^)/
- 数値が0%に近ければ、(((( ;゚д゚))))アワワワワ
という雰囲気を示します.
計算式は,
Highの銘柄数 / (Highの銘柄数 + Lowの銘柄数)
という簡単なモノです.
これだとブレが大きいので10日移動平均を取ることが多いです.
Quantopian Research を使う
では,Quantopian Research を使って,計算してみましょう.
from quantopian.pipeline.experimental import QTradableStocksUS
from quantopian.pipeline.data.builtin import USEquityPricing
from quantopian.pipeline.factors import CustomFactor
from quantopian.research import run_pipeline
from quantopian.pipeline import Pipeline
import numpy as np
class isHighToday(CustomFactor):
inputs = [USEquityPricing.high]
window_length = 252
def compute(self, today, asset_ids, out, values):
max_values = np.nanmax(values,axis=0)
high_252 = max_values == values[-1]
out[:] = high_252
class isLowToday(CustomFactor):
inputs = [USEquityPricing.low]
window_length = 252
def compute(self, today, asset_ids, out, values):
min_values = np.nanmin(values,axis=0)
low_252 = min_values == values[-1]
out[:] = low_252
def make_pipeline1():
base_universe = QTradableStocksUS()
pipe = Pipeline()
pipe.add(isHighToday(), "isHighToday")
pipe.add(isLowToday(), "isLowToday")
pipe.set_screen(base_universe)
return pipe
start_date = '2017-01-01'
end_date = '2017-12-22'
results = run_pipeline(make_pipeline1(),
start_date=start_date,
end_date = end_date )
# highlows = results.reset_index().groupby(by = "level_0")[["isHighToday", "isLowToday"]].sum()
highlows = results.groupby(level=0)[["isHighToday", "isLowToday"]].sum()
highlows["high_low_ratio"] = highlows["isHighToday"] / ( highlows["isHighToday"] + highlows["isLowToday"])
highlows["high_low_ratio_ma10"] = highlows["high_low_ratio"].rolling(10).mean()
spy = get_pricing("SPY", start_date=start_date,end_date= end_date, fields='price')
highlows["spy"] = spy
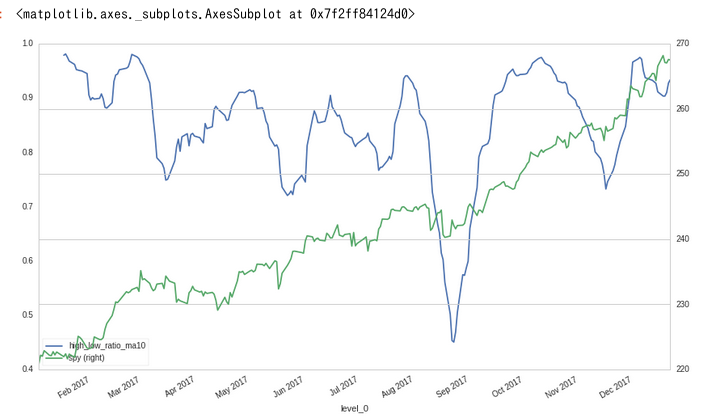
highlows[["high_low_ratio_ma10", "spy"]].plot(secondary_y = "spy")
解説
-
銘柄の選定は
base_universe = QTradableStocksUS()で行っています.これは Quantopian が用意している,トレーダブルな銘柄集です.詳しくはQTradableStocksUS()をご参照下さい. -
9月頃にHighLowRatioが大きく落ちていますが,これは8月17日のトランプ氏、2助言組織を解散 企業首脳が相次ぎ辞任を受けてマーケットが過剰反応し,SPが1.5%以上落ちた影響を受けています.
-
multiindex を reset_index せずに groupby する方法がわからず,reset しています.どなたかご存知でしたらご教授下さいm(__)mコメントで @driller さんに教えて頂きました!ありがとうございます! -
次回イベントでは,やはりリサーチの勉強した方が良いかもしれないな...
今後の Tokyo Quantopian User Group
相変わらずなにも決めてないのですが,1月にしたい!という希望だけはあります!
メリークリスマス!