今までグラフを描くときにIPythonばかり使っていたのですが、
「ログファイルから該当箇所だけ抜き出して即グラフ化して状況把握したい。3秒で!」ということが仕事上多くなってきました。
IPythonだと、IPython起動して、データファイルをオープンしてグラフ表示するまでに4,5行のコードが要りますよね。
gnuplotとgrepコマンドの組み合わせでもっとサクッとやる方法のメモです。
gnuplotのインストールは apt-get で問題ありません。
ここで使うデータファイル
適当なのが見つからなかったので、top > top.txt してしばらく放置したものをデータとします。
firefoxのCPU利用率とメモリ利用率をプロットすることにします。
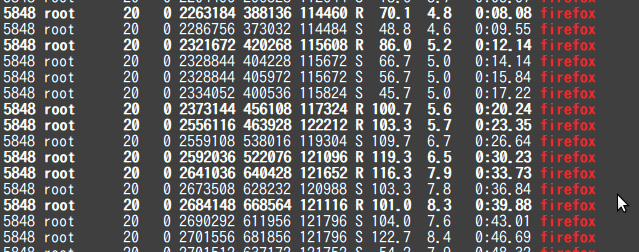
以下のようなデータが一定時間分あるのが top.txt と思ってください。

grep で firefox のところだけ抜きだすとこんな感じ。
でもgrepしたものをいちいち別ファイルにするのは手間だからやりたくない。

プロット手順
基本的には以下のみです。
- gnuplotの対話モードに入る(1行)
- プロットする(1行)
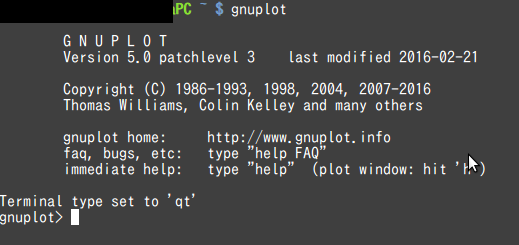
gnuplot の対話モードに入る(1行)
terminal上で gnuplot と入力するのみです。IPythonで言うなら ipython -i と同じようなモードに入ります。

プロットする(1行)
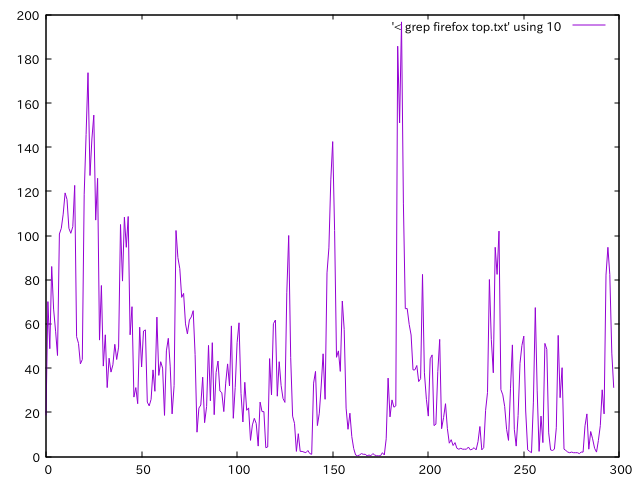
plot '< grep firefox top.txt' using 10 w l
で以下のグラフが表示されます。
- < はリダイレクト的なものです。 > は要らないので注意。' 'の中に直接Linuxコマンドが書けます。
- using 10 の 10 はプロットする列です。using 1:2 などとすれば x軸に1列目、y軸に2列目でやってくれる。
- w l は with line の意味です。w lp とやれば linepointsになる。
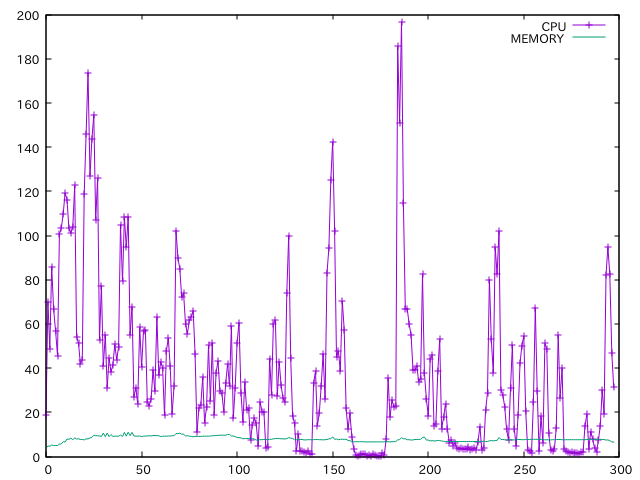
複数列プロットしたいならば、カンマで続けて書く。凡例は title で付けられます。
plot '< grep firefox top.txt' using 10 w lp title 'CPU', '< grep firefox top.txt' using 11 w l title 'MEMORY'
備考
対話モードに入らずとも、terminal上から直接やることも可能です。
terminal$ gnuplot -p -e 'plot "< grep firefox top.txt" using 10'
といった感じで。
オプションが要らず覚えやすいという意味でこの方法を記載しました。
私もgnuplot初心者なので、より良い方法があればご教示いただけると幸いです。
おわり

