今回が初の投稿となります。また、機械学習初心者です。理解が足りておらずおかしなことを言っていたり、見づらい部分も多々あるかとは思いますが、温かく見守っていただけると幸いです!
クラスの初期化
from keras.datasets import mnist
from keras.utils import to_categorical
from keras.models import Model, model_from_json
from keras.layers import Input, Conv2D, MaxPooling2D, Dense, Flatten, Dropout
import numpy as np
import seaborn as sns
import os


class Visualize_CNN():
    def __init__(self):
        self.conv1_filter_num = 32
        self.conv1_filter_size = (3,3)
        self.conv1_strides = 1
        self.pool1_filter_size = (2,2)

        self.conv2_filter_num = 64
        self.conv2_filter_size = (5,5)
        self.conv2_strides = 1
        self.pool2_filter_size = (2,2)

        self.dense1_output = 1024
        self.dense2_output = 10

        self.epochs = 1
        self.batch_size = 128

        self.figsize = (10,10)
        self.save_file_path = "../data/model"
データを読み込む
    def load_data(self):
        (x_train, y_train),(x_test,y_test) = mnist.load_data()
        x_train = x_train.astype("float32")/ 256
        x_train = x_train.reshape((-1,28,28,1))
        x_test = x_test.astype("float32")/ 256
        x_test = x_test.reshape((-1,28,28,1))
        y_train = to_categorical(y_train)
        y_test = to_categorical(y_test)

        return x_train, y_train, x_test, y_test
keras.datasetsからmnistデータを読み込んで前処理を行っています。
x_train、x_testに行ったのはタイプの指定とnormalization(正規化)です。今回行ったnormalizationはMin-Max normalizationです。数式で書くと、
y = \frac{x - x_{min}}{x_{max} - x_{min}}
x_{max}:与えられたデータの中の最大値,
x_{min}:は与えられたデータの中の最小値
となります。与えられた各データを最大値と最小値の幅で割ってやると、最大値が1、最小値が0にスケーリングすることができますよね。そのため、Min-Max normalizationというんだと思います。今回扱うデータはmnistです。そのため、グレイスケールで各ピクセルの値?は0~255だとわかっているので数式の最小値部分には0、最大値の部分には255が入ります。
y_train、y_testはone-hotラベルのデータにしています。今回はkeras.utilsの中のto_categoricalにそれぞれ引数をして与えることで自動的にデータを変換してもらっています。
モデルを構築する
    def creat_model(self):
        input_model = Input(shape=(28,28,1))
        conv1 = Conv2D(self.conv1_filter_num,
                       self.conv1_filter_size,
                       padding="same",
                       activation="relu")(input_model)
        pool1 = MaxPooling2D(self.pool1_filter_size)(conv1)
        conv2 = Conv2D(self.conv2_filter_num,
                       self.conv2_filter_size,
                       padding="same",
                       activation="relu"
                      )(pool1)
        pool2 = MaxPooling2D(self.pool2_filter_size)(conv2)
        flat = Flatten()(pool2)
        dense1 = Dense(self.dense1_output,
                      activation="relu")(flat)
        dropout = Dropout(0.25)(dense1)
        dense2 = Dense(self.dense2_output,
                      activation="softmax")(dropout)

        model = Model(inputs=input_model, output=dense2)
        return model
今回構築したモデルは二回畳み込んで結合させるだけの簡単なものです。各レイヤーのフィルター数(カラム数?)やサイズはクラスの初期化の部分に載せています。
モデルの訓練と保存
    def train_and_save(self):
        x_train, y_train, x_test, y_test = self.load_data()
        model =  self.creat_model_()
        model.compile(optimizer="adam",
                     loss="categorical_crossentropy",
                     metrics=["accuracy"])
        #model.summary()
        history = model.fit(x_train, y_train,
                           batch_size=self.batch_size,
                           epochs=self.epochs,
                           verbose=2,
                           validation_data=(x_test, y_test))
    json_string = model.to_json()
       open(os.path.join(self.save_file_path, "model.json"),"w").write(json_string)
       model.save_weights(os.path.join(self.save_file_path, "model_weights.h5"))
       print("saving succsessful")
構築したモデルを学習させ、モデルと学習した重みを保存します。model.save(save_file_path)とかするとモデルと重みを同時に保存してくれるらしいのですが、コードを書いた当時の自分は知らなかったので別々に保存しています。
中間層の可視化
    def visualize(self):
        x_train,a,b,c = self.load_data()
        json_string = open(os.path.join(self.save_file_path, "model.json")).read()
        model = model_from_json(json_string)
        model.load_weights(os.path.join(self.save_file_path, "model_weights.hdf5"))
        layers = model.layers[1:5]
        outputs = [layer.output for layer in layers]
        acctivation_model = Model(inputs=model.input, output=outputs)
        acctivation_model.summary()

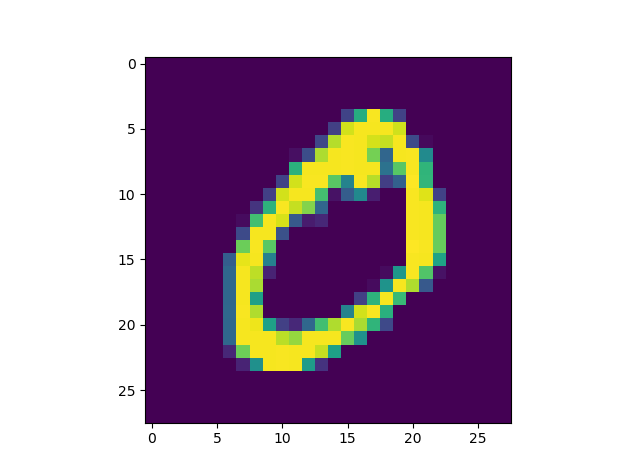
        image = x_train[1].reshape(-1,28,28,1)#入力画像を変更したかったらx_train[j]のjを変化させてください!
        plt.imshow(image.reshape(28,28))
        activation = acctivation_model.predict(image)
        x_axis = 8
        y_axis = 8
        for j in range(len(activation)):
            cul_num = activation[j].shape[3]
            act = activation[j]
            plt.figure(figsize=(self.figsize))

            for i in range(cul_num):
                plt.subplot(8,8,i+1)
                sns.heatmap(act[0,:,:,i])
        plt.show()
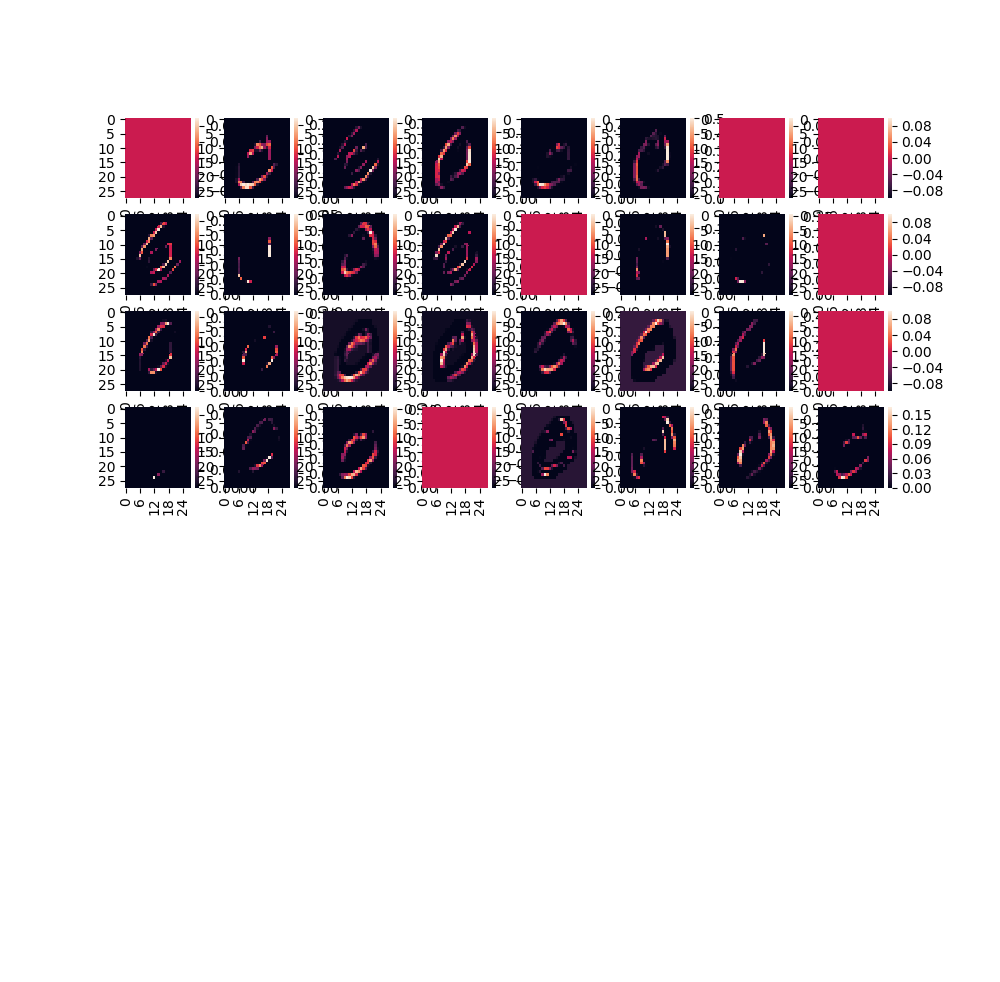
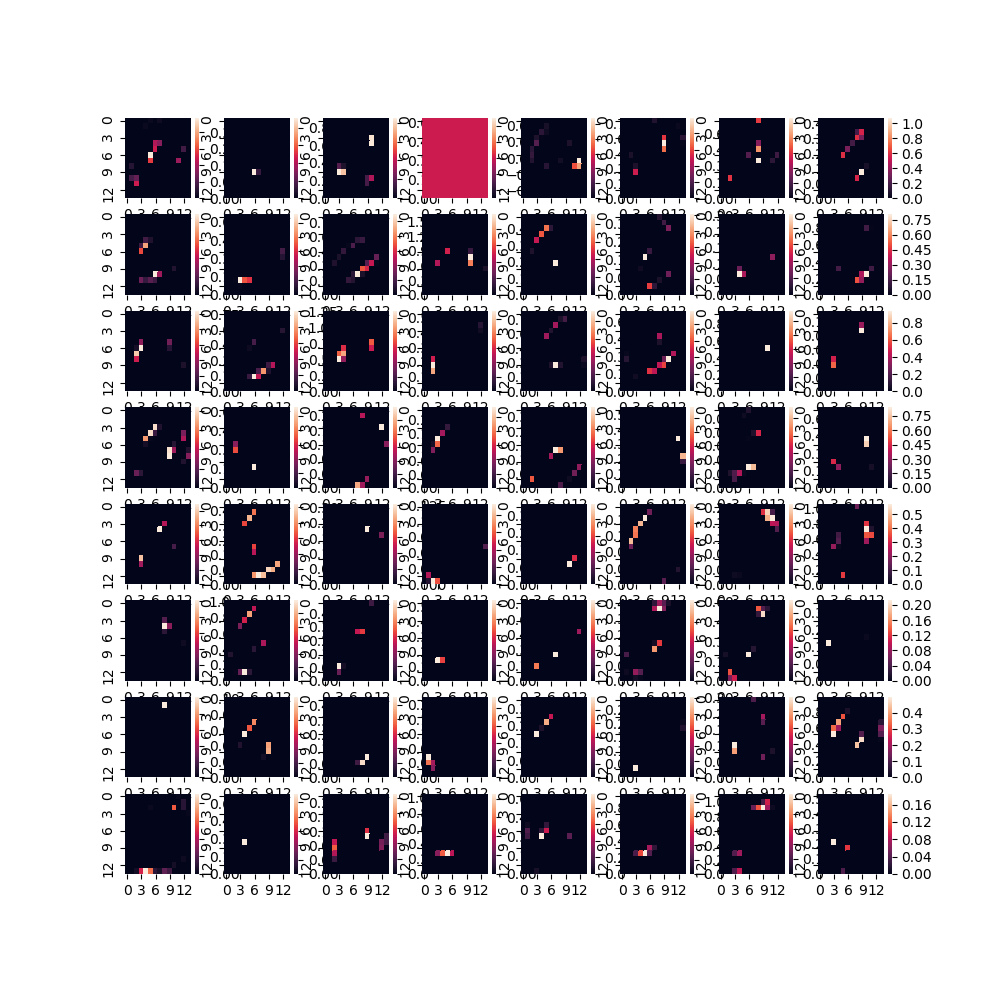
最後に保存したモデルと重みをロードして、全結合層以外の層の出力を出力するモデルを再定義し、その出力をヒートマップにして出力しています。
結果
結果は以下の通りになりました。
入力画像

畳み込み層1の出力

畳み込み層2の出力

まとめ
以上、初投稿とニューラルネットワークの中間層の可視化をやってみた!でした。
ここをこうやったら見やすくなるよ!等のアドバイス大歓迎です!
最後まで見てくださってありがとうございましたm(_ _)m