Azure Kubernetes Serviceで、Runningステータス以外のコンテナが存在したらSlackにアラート通知するということを実現したく、色々模索しました。
Azure MonitorのメトリクスをSlack通知するときはLogic Appsを使うのが多いと思いますが、Log AnalyticsアラートはLogic Appsだとうまく実現できなかったため、Webhookのカスタムペイロードで対応しました。
Log Analyticsログ検索
-
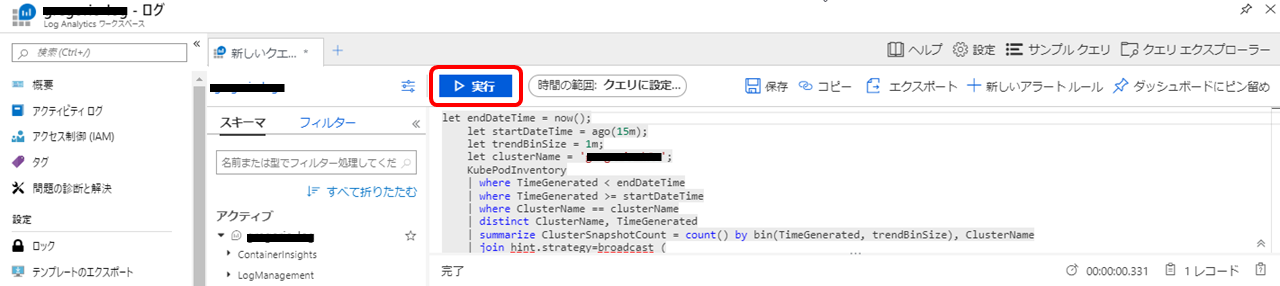
Log Analyticsワークスペースを開いて、アラート条件となるクエリを実行します。
-
今回はAKSでRunning以外のコンテナが存在したらという条件なので、以下のように設定しました。全てRunningステータスならクエリ結果は0件になります。
let endDateTime = now();
    let startDateTime = ago(15m);
    let trendBinSize = 1m;
    let clusterName = '[Your AKS Cluster Name]';
    KubePodInventory
    | where TimeGenerated < endDateTime
    | where TimeGenerated >= startDateTime
    | where ClusterName == clusterName
    | distinct ClusterName, TimeGenerated
    | summarize ClusterSnapshotCount = count() by bin(TimeGenerated, trendBinSize), ClusterName
    | join hint.strategy=broadcast (
        KubePodInventory
        | where TimeGenerated < endDateTime
        | where TimeGenerated >= startDateTime
        | distinct ClusterName, Computer, PodUid, TimeGenerated, PodStatus
        | summarize TotalCount = count(),
                    PendingCount = sumif(1, PodStatus =~ 'Pending'),
                    RunningCount = sumif(1, PodStatus =~ 'Running'),
                    SucceededCount = sumif(1, PodStatus =~ 'Succeeded'),
                    FailedCount = sumif(1, PodStatus =~ 'Failed')
                 by ClusterName, bin(TimeGenerated, trendBinSize)
    ) on ClusterName, TimeGenerated
    | extend UnknownCount = TotalCount - PendingCount - RunningCount - SucceededCount - FailedCount
    | project TimeGenerated,
              TotalCount = todouble(TotalCount) / ClusterSnapshotCount,
              PendingCount = todouble(PendingCount) / ClusterSnapshotCount,
              RunningCount = todouble(RunningCount) / ClusterSnapshotCount,
              SucceededCount = todouble(SucceededCount) / ClusterSnapshotCount,
              FailedCount = todouble(FailedCount) / ClusterSnapshotCount,
              UnknownCount = todouble(UnknownCount) / ClusterSnapshotCount
| summarize AggregatedValue = avg(PendingCount) + avg(FailedCount) + avg(UnknownCount) by bin(TimeGenerated, trendBinSize)
| where AggregatedValue > 0
- 公式ページにAKSを監視したいときのサンプルクエリが載ってますのでそれを参考にしました。
コンテナー用 Azure Monitor でパフォーマンスの問題に関するアラートを設定する方法
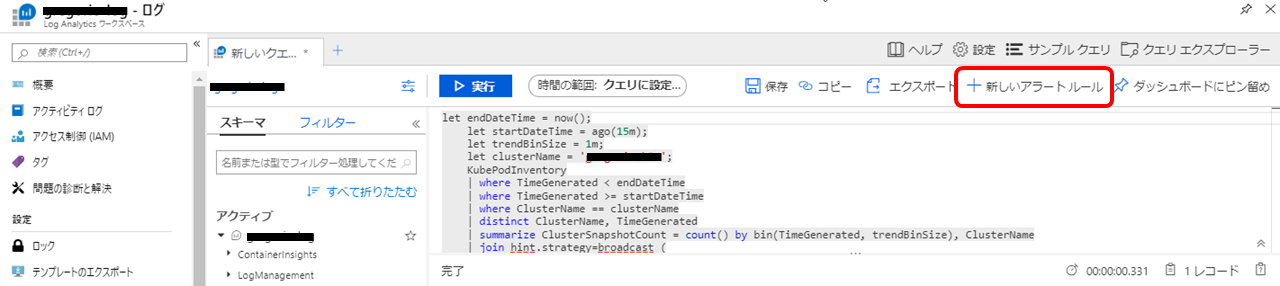
- クエリを実行したら[新しいアラートルール]を選択します。
アラートルール作成
-
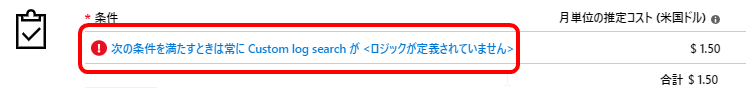
条件を選択します。
-
しきい値を以下のように設定します。

-
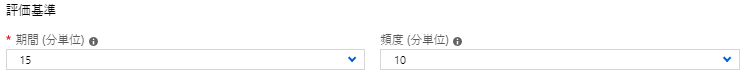
要件に合わせて評価基準を設定します。今回は10分単位に、15分前の期間まで遡ってチェックする設定にしてます。頻度次第で月額料金が変わるので注意です。
-
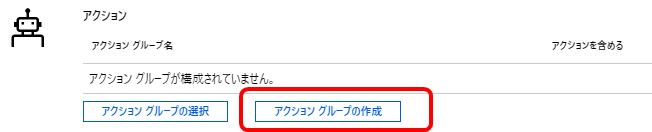
続いてアクショングループを作成します。
-
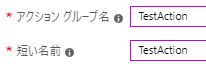
アクショングループ名と短い名前を設定します。
-
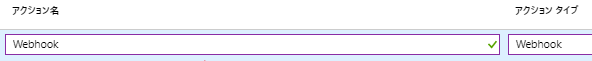
アクション名を入力し、アクションタイプに[Webhook]を選択します。
-
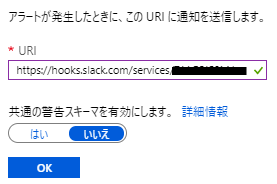
URIにSlack Incomming WebhookのURIを入力します。Incomming WebhookはSlackから取得してください。Slackの手順は割愛します。
-
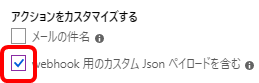
[webhook用のカスタムJsonペイロードを含む]にチェックを入れます。
-
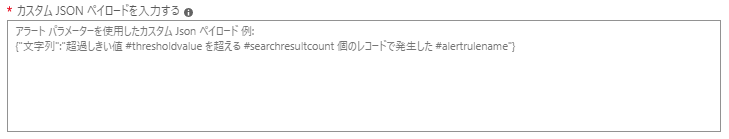
カスタムJSONペイロードにSlack API Attachementの記法に従って入力します。
-
例として以下のように設定できます。
{
    "attachments": [
        {
            "fields": [
                {
                    "title": "Alert Rule Name",
                    "value": "#alertrulename"
                },
                {
                    "title": "重大度",
                    "value": "#severity"
                },
                {
                    "title": "詳細メッセージ",
                    "value": "Failed、Pending、Unknownステータスのコンテナが存在しています"
                }
            ],
            "color": "danger"
        }
    ],
    "username": "Test Alert User",
    "icon_emoji": ":ghost:",
    "channel":"#general"
}
-
"#alertrulename" などのLog Analytics独自のパラメータは以下を参考ください。
ログ アラート ルールの webhook アクション -
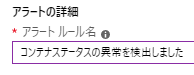
次にアラートルール名を入力します。
-
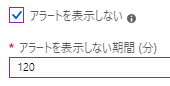
必要に応じて[アラートを表示しない期間]を入れておきます。これを付けると、時間内に同じアラートルールで検知した場合アラートを出さなくなります。
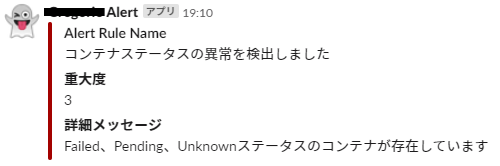
Slack通知結果
- アラートルールを満たすと、こんな感じで通知されます。カスタムペイロードを変更することで自由にカスタマイズ可能です。