はじめに
OpenShift 4.10でTP機能としてOpenShift Logging 5.4を使うことでEFKスタックの代わりにVectorとGrafana Lokiが利用できるようになりました。
試しにこの機能をデプロイして、Grafanaダッシュボード上からアプリケーションのログが確認できるところまでの作業ログをまとめます。
注意
- この機能はTPのため、Red HatのSLAの対象外になります。
- 動作することを最優先したため、商用利用に適していない設定が含まれます。
- 作業ログのため、機能の詳細な説明は省略します(というかできない)
前提条件
- AWS上にデプロイしたOpenShift 4.10 (IPIインストール)
- AWSのAdministratorAccess権限を持つIAMユーザー
- OpenShiftのCluster-Admin権限
作業ログ
openshift-loggingProject作成
apiVersion: v1
kind: Namespace
metadata:
  name: openshift-logging
  annotations:
    openshift.io/node-selector: ""
  labels:
    openshift.io/cluster-logging: "true"
    openshift.io/cluster-monitoring: "true"
oc apply -f project.yaml
Operatorインストール
コンソール上からOperatorをインストール(どちらもデフォルト設定)
Red Hat OpenShift LoggingLoki Operator
S3バケット作成
- バケット名:
openshift-loki - AWSリージョン:
ap-northeast-1 -
パブリックアクセスをすべて ブロックにチェック
Loki用のSecret作成
BUCKET_NAME=openshift-loki
NAMESPACE=openshift-logging
REGION="ap-northeast-1"
ACCESS_KEY_ID=$(aws configure get aws_access_key_id)
SECRET_ACCESS_KEY=$(aws configure get aws_secret_access_key)

oc project openshift-logging

oc -n ${NAMESPACE} create secret generic lokistack-s3-secret \
  --from-literal=region=$(echo -n "${REGION}") \
  --from-literal=bucketnames=$(echo -n "${BUCKET_NAME}") \
  --from-literal=access_key_id=$(echo -n "${ACCESS_KEY_ID}") \
  --from-literal=access_key_secret=$(echo -n "${SECRET_ACCESS_KEY}") \
  --from-literal=endpoint=$(echo -n "https://s3.${REGION}.amazonaws.com")
Lokistack作成
- 今回は最小スペックで構築
apiVersion: loki.grafana.com/v1beta1
kind: LokiStack
metadata:
  name: lokistack-dev
  namespace: openshift-logging
spec:
  managementState: Managed
  storage:
    secret:
      name: lokistack-s3-secret
      type: s3
  tenants:
    mode: openshift-logging
  size: 1x.extra-small
  storageClassName: gp2
oc apply -f lokistack.yaml
ClusterLogging作成
- annotationを追加
-
collection.logs.typeをvectorにセット
kind: ClusterLogging
apiVersion: logging.openshift.io/v1
metadata:
  name: instance
  namespace: openshift-logging
  annotations:
    logging.openshift.io/preview-vector-collector: enabled
spec:
  managementState: Managed
  collection:
    logs:
      type: vector
      vector: {}
oc apply -f cluster-logging.yaml
logcollector用のRBAC作成
---
apiVersion: rbac.authorization.k8s.io/v1
kind: ClusterRole
metadata:
  name: lokistack-dev-tenant-logs
rules:
- apiGroups:
  - 'loki.grafana.com'
  resources:
  - application
  - infrastructure
  - audit
  resourceNames:
  - logs
  verbs:
  - 'create'
---
apiVersion: rbac.authorization.k8s.io/v1
kind: ClusterRoleBinding
metadata:
  name: lokistack-dev-tenant-logs
roleRef:
  apiGroup: rbac.authorization.k8s.io
  kind: ClusterRole
  name: lokistack-dev-tenant-logs
subjects:
- kind: ServiceAccount
  name: logcollector
  namespace: openshift-logging
oc apply -f loki-rbac.yaml
log-forwarder用のsecret作成
oc -n openshift-logging get cm lokistack-dev-ca-bundle \
  -o jsonpath="{.data.service-ca\.crt}" > ca_bundle.crt

oc -n openshift-logging create secret generic loki-distributor-ca \
  --from-file=ca-bundle.crt=./ca_bundle.crt
ClusterLogForwarder作成
apiVersion: logging.openshift.io/v1
kind: ClusterLogForwarder
metadata:
  name: instance
  namespace: openshift-logging
spec:
  outputs:
  - name: loki-app
    type: loki
    url: https://lokistack-dev-gateway-http.openshift-logging.svc:8080/api/logs/v1/application/
    secret:
      name: lokistack-gateway-bearer-token
  - name: loki-infra
    type: loki
    url: https://lokistack-dev-gateway-http.openshift-logging.svc:8080/api/logs/v1/infrastructure/
    secret:
      name: lokistack-gateway-bearer-token
  - name: loki-audit
    type: loki
    url: https://lokistack-dev-gateway-http.openshift-logging.svc:8080/api/logs/v1/audit/
    secret:
      name: lokistack-gateway-bearer-token
  pipelines:
  - name: send-app-logs
    inputRefs:
    - application
    outputRefs:
    - loki-app
  - name: send-infra-logs
    inputRefs:
    - infrastructure
    outputRefs:
    - loki-infra
  - name: send-infra-audit
    inputRefs:
    - audit
    outputRefs:
    - loki-audit
Grafana作成
addon_grafana_gateway_ocp_oauth.yaml(長いので折りたたみ)
apiVersion: v1
kind: ServiceAccount
metadata:
  annotations:
    serviceaccounts.openshift.io/oauth-redirectreference.grafana: '{"kind":"OAuthRedirectReference","apiVersion":"v1","reference":{"kind":"Route","name":"grafana"}}'
  name: grafana
  namespace: openshift-logging
---
apiVersion: rbac.authorization.k8s.io/v1
kind: ClusterRole
metadata:
  name: logging-application-logs-reader
rules:
- apiGroups:
  - loki.grafana.com
  resourceNames:
  - logs
  resources:
  - application
  verbs:
  - get
---
apiVersion: rbac.authorization.k8s.io/v1
kind: ClusterRoleBinding
metadata:
  name: logging-grafana-auth-delegator
roleRef:
  apiGroup: rbac.authorization.k8s.io
  kind: ClusterRole
  name: system:auth-delegator
subjects:
- kind: ServiceAccount
  name: grafana
  namespace: openshift-logging
---
apiVersion: rbac.authorization.k8s.io/v1
kind: ClusterRoleBinding
metadata:
  name: logging-users-application-logs-reader
roleRef:
  apiGroup: rbac.authorization.k8s.io
  kind: ClusterRole
  name: logging-application-logs-reader
subjects:
- apiGroup: rbac.authorization.k8s.io
  kind: Group
  name: system:authenticated
---
apiVersion: v1
data:
  config.ini: |
    [analytics]
    check_for_updates = false
    reporting_enabled = false
    [auth]
    disable_login_form = true
    disable_signout_menu = true
    [auth.basic]
    enabled = false
    [auth.proxy]
    auto_sign_up = true
    enabled = true
    header_name = X-Forwarded-User
    [paths]
    data = /var/lib/grafana
    logs = /var/lib/grafana/logs
    plugins = /var/lib/grafana/plugins
    provisioning = /etc/grafana/provisioning
    [security]
    admin_user = system:does-not-exist
    cookie_secure = true
    [users]
    viewers_can_edit = true
    default_theme = light
    [log]
    mode = console
kind: ConfigMap
metadata:
  name: grafana-config-5kt2h4545b
  namespace: openshift-logging
---
apiVersion: v1
data:
  loki.yaml: |
    apiVersion: 1
    datasources:
      - name: Loki (Application)
        isDefault: true
        type: loki
        access: proxy
        url: https://${GATEWAY_ADDRESS}/api/logs/v1/application/
        jsonData:
          tlsAuthWithCACert: true
        secureJsonData:
          tlsCACert: ${GATEWAY_SERVICE_CA}
      - name: Loki (Infrastructure)
        type: loki
        access: proxy
        url: https://${GATEWAY_ADDRESS}/api/logs/v1/infrastructure/
        jsonData:
          tlsAuthWithCACert: true
        secureJsonData:
          tlsCACert: ${GATEWAY_SERVICE_CA}
      - name: Loki (Audit)
        type: loki
        access: proxy
        url: https://${GATEWAY_ADDRESS}/api/logs/v1/audit/
        jsonData:
          tlsAuthWithCACert: true
        secureJsonData:
          tlsCACert: ${GATEWAY_SERVICE_CA}
kind: ConfigMap
metadata:
  name: grafana-datasources-d9f6t65c72
  namespace: openshift-logging
---
apiVersion: v1
kind: Service
metadata:
  annotations:
    service.alpha.openshift.io/serving-cert-secret-name: grafana-tls
  labels:
    app: grafana
  name: grafana
  namespace: openshift-logging
spec:
  ports:
  - name: https
    port: 8443
    protocol: TCP
    targetPort: https
  - name: http-grafana
    port: 3000
    protocol: TCP
    targetPort: http-grafana
  selector:
    app: grafana
  sessionAffinity: None
  type: ClusterIP
---
apiVersion: apps/v1
kind: StatefulSet
metadata:
  labels:
    app: grafana
  name: grafana
  namespace: openshift-logging
spec:
  selector:
    matchLabels:
      app: grafana
  serviceName: grafana
  template:
    metadata:
      labels:
        app: grafana
    spec:
      containers:
      - args:
        - -config=/etc/grafana/config.ini
        env:
        - name: GATEWAY_SERVICE_CA
          valueFrom:
            configMapKeyRef:
              key: service-ca.crt
              name: openshift-service-ca.crt
        - name: GATEWAY_ADDRESS
          value: lokistack-dev-gateway-http.openshift-logging.svc:8080
        - name: GF_SECURITY_ADMIN_USER
          value: kube:admin
        image: docker.io/grafana/grafana:8.5.6
        imagePullPolicy: IfNotPresent
        livenessProbe:
          failureThreshold: 3
          initialDelaySeconds: 30
          periodSeconds: 10
          successThreshold: 1
          tcpSocket:
            port: 3000
          timeoutSeconds: 1
        name: grafana
        ports:
        - containerPort: 3000
          name: http-grafana
          protocol: TCP
        readinessProbe:
          failureThreshold: 3
          httpGet:
            path: /robots.txt
            port: 3000
            scheme: HTTP
          initialDelaySeconds: 10
          periodSeconds: 30
          successThreshold: 1
          timeoutSeconds: 2
        resources:
          requests:
            cpu: 250m
            memory: 256Mi
        volumeMounts:
        - mountPath: /etc/grafana
          name: grafana-config
        - mountPath: /var/lib/grafana
          name: grafana
        - mountPath: /etc/grafana/provisioning/datasources
          name: grafana-datasources
      - args:
        - -provider=openshift
        - -https-address=:8443
        - -http-address=
        - -upstream=http://localhost:3000
        - -tls-cert=/etc/tls/private/tls.crt
        - -tls-key=/etc/tls/private/tls.key
        - -client-id=system:serviceaccount:openshift-logging:grafana
        - -client-secret-file=/var/run/secrets/kubernetes.io/serviceaccount/token
        - -cookie-secret=ZXhhbXBsZS1jb29raWUtc2VjcmV0enp6
        - -cookie-expire=24h
        - -skip-provider-button
        - -scope=user:info user:check-access user:list-projects
        - -pass-access-token
        - -pass-basic-auth=false
        env:
        - name: HTTP_PROXY
        - name: HTTPS_PROXY
        - name: NO_PROXY
        image: quay.io/openshift/origin-oauth-proxy:4.10
        imagePullPolicy: IfNotPresent
        name: grafana-proxy
        ports:
        - containerPort: 8443
          name: https
          protocol: TCP
        readinessProbe:
          failureThreshold: 3
          httpGet:
            path: /oauth/healthz
            port: https
            scheme: HTTPS
          periodSeconds: 10
          successThreshold: 1
          timeoutSeconds: 1
        resources:
          requests:
            cpu: 1m
            memory: 20Mi
        terminationMessagePath: /dev/termination-log
        terminationMessagePolicy: File
        volumeMounts:
        - mountPath: /etc/tls/private
          name: secret-grafana-tls
      serviceAccountName: grafana
      volumes:
      - configMap:
          name: grafana-config-5kt2h4545b
        name: grafana-config
      - name: secret-grafana-tls
        secret:
          defaultMode: 420
          secretName: grafana-tls
      - configMap:
          name: grafana-datasources-d9f6t65c72
        name: grafana-datasources
  volumeClaimTemplates:
  - metadata:
      labels:
        app: grafana
      name: grafana
    spec:
      accessModes:
      - ReadWriteOnce
      resources:
        requests:
          storage: 1Gi
---
apiVersion: route.openshift.io/v1
kind: Route
metadata:
  name: grafana
  namespace: openshift-logging
spec:
  port:
    targetPort: https
  tls:
    insecureEdgeTerminationPolicy: Redirect
    termination: reencrypt
  to:
    kind: Service
    name: grafana
    weight: 100
  wildcardPolicy: None
oc apply -f addon_grafana_gateway_ocp_oauth.yaml
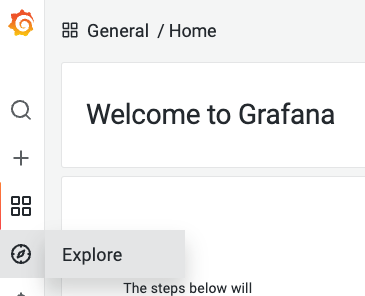
Grafanaにログイン
oc get route grafana -o jsonpath="{.status.ingress[0].host}"
ログインするとOpenShiftの認証画面に行くので、OpenShiftのユーザーでログイン
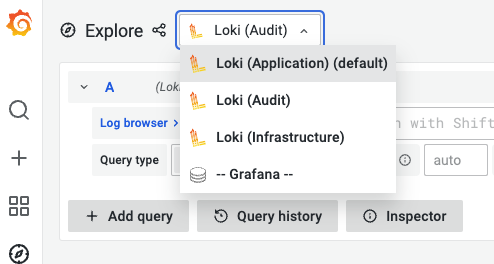
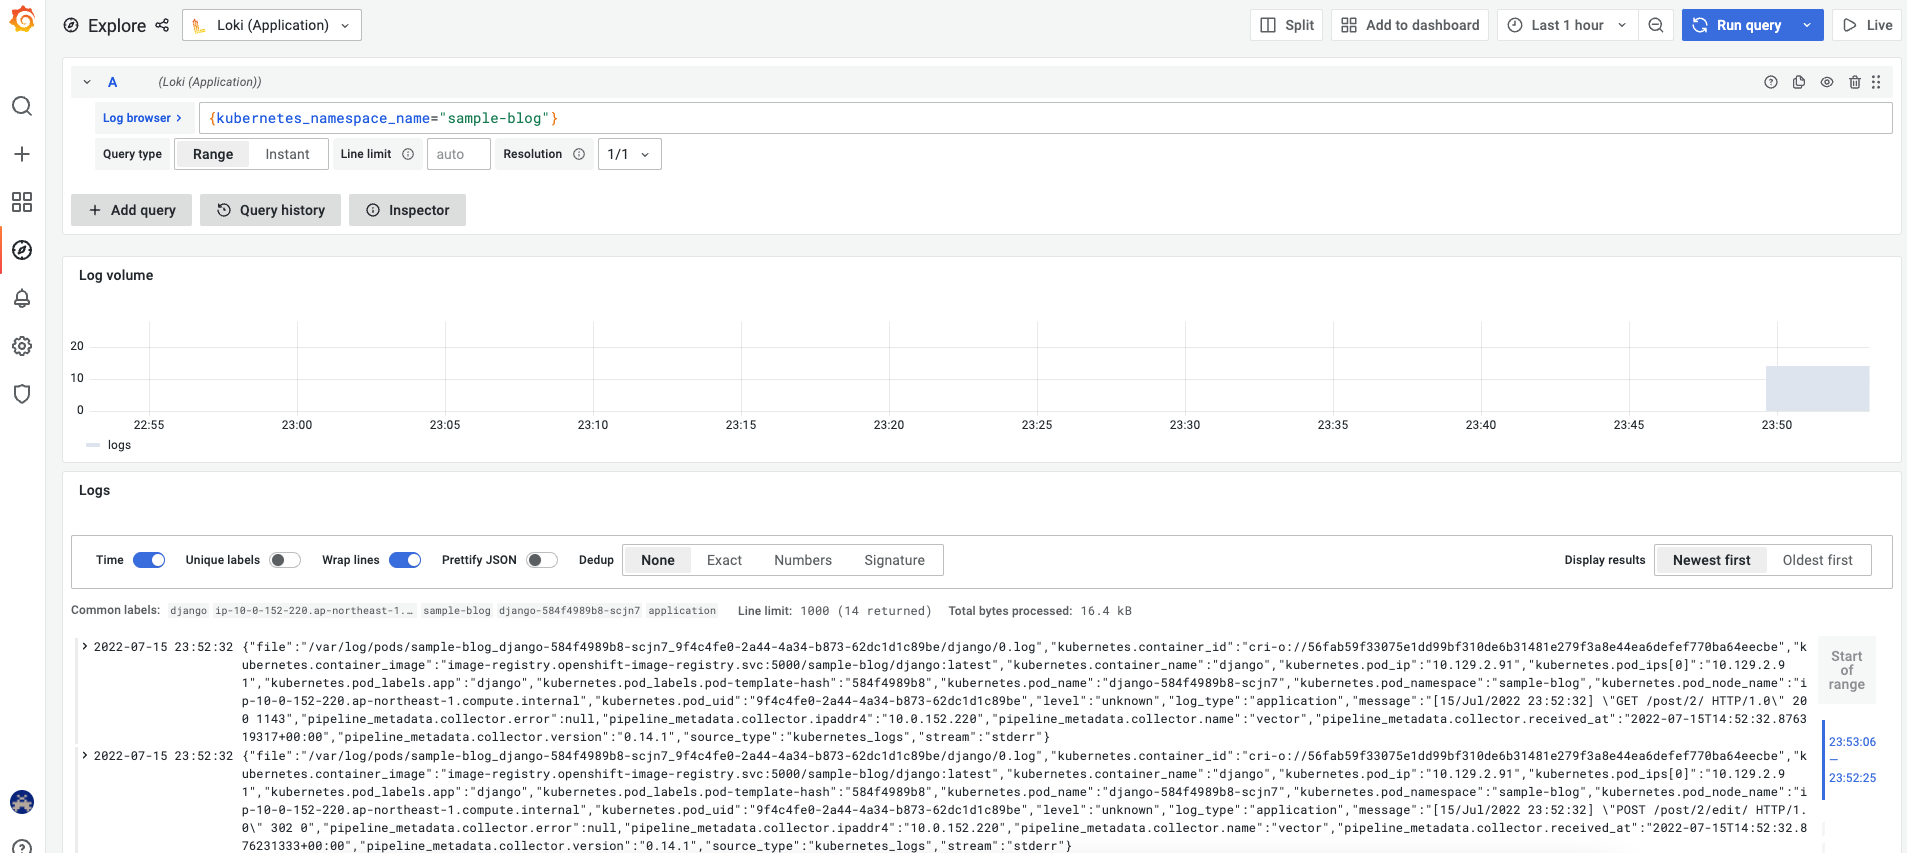
画面左メニューからExploreを選択
プルダウンでApplication Audit Infrastructure が選択できる
1. Select labels to search in でラベルを選択後、 下に出てくる候補を選んでShow logsをクリック
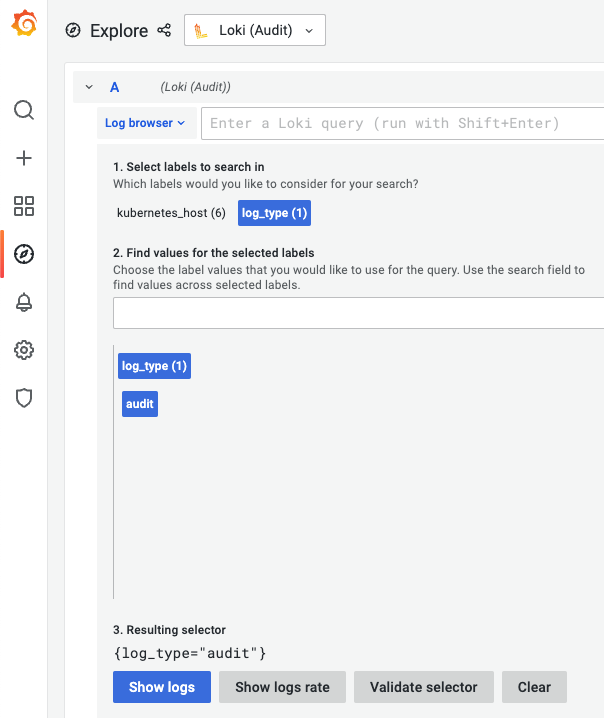
ログが表示される
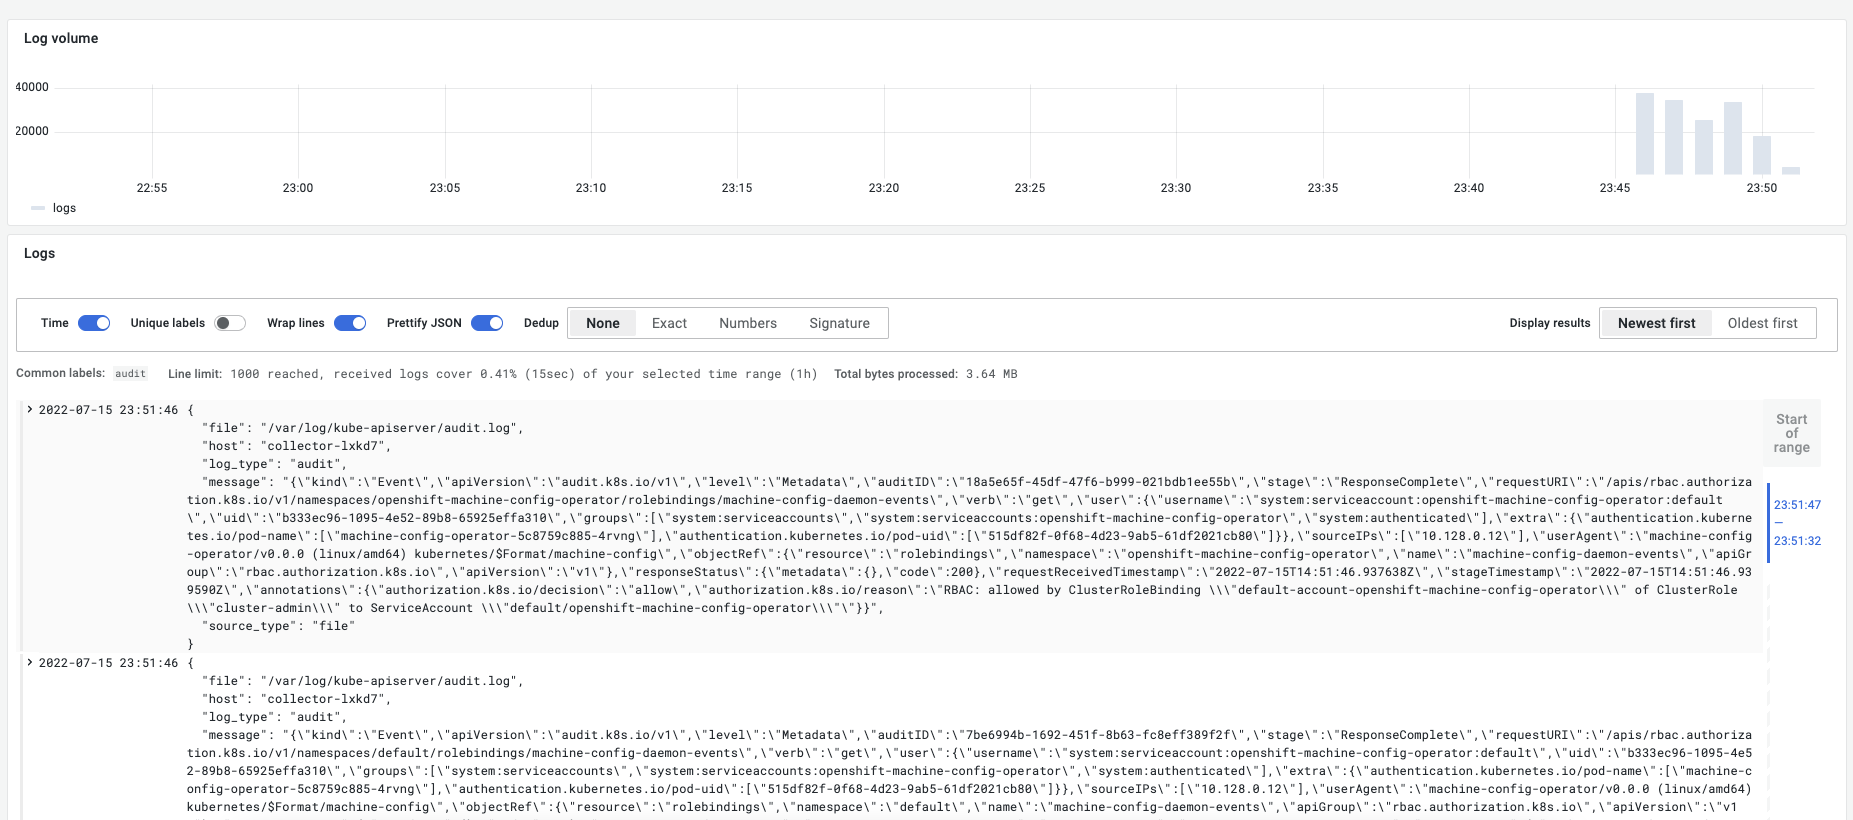
ApplicationのログもOK
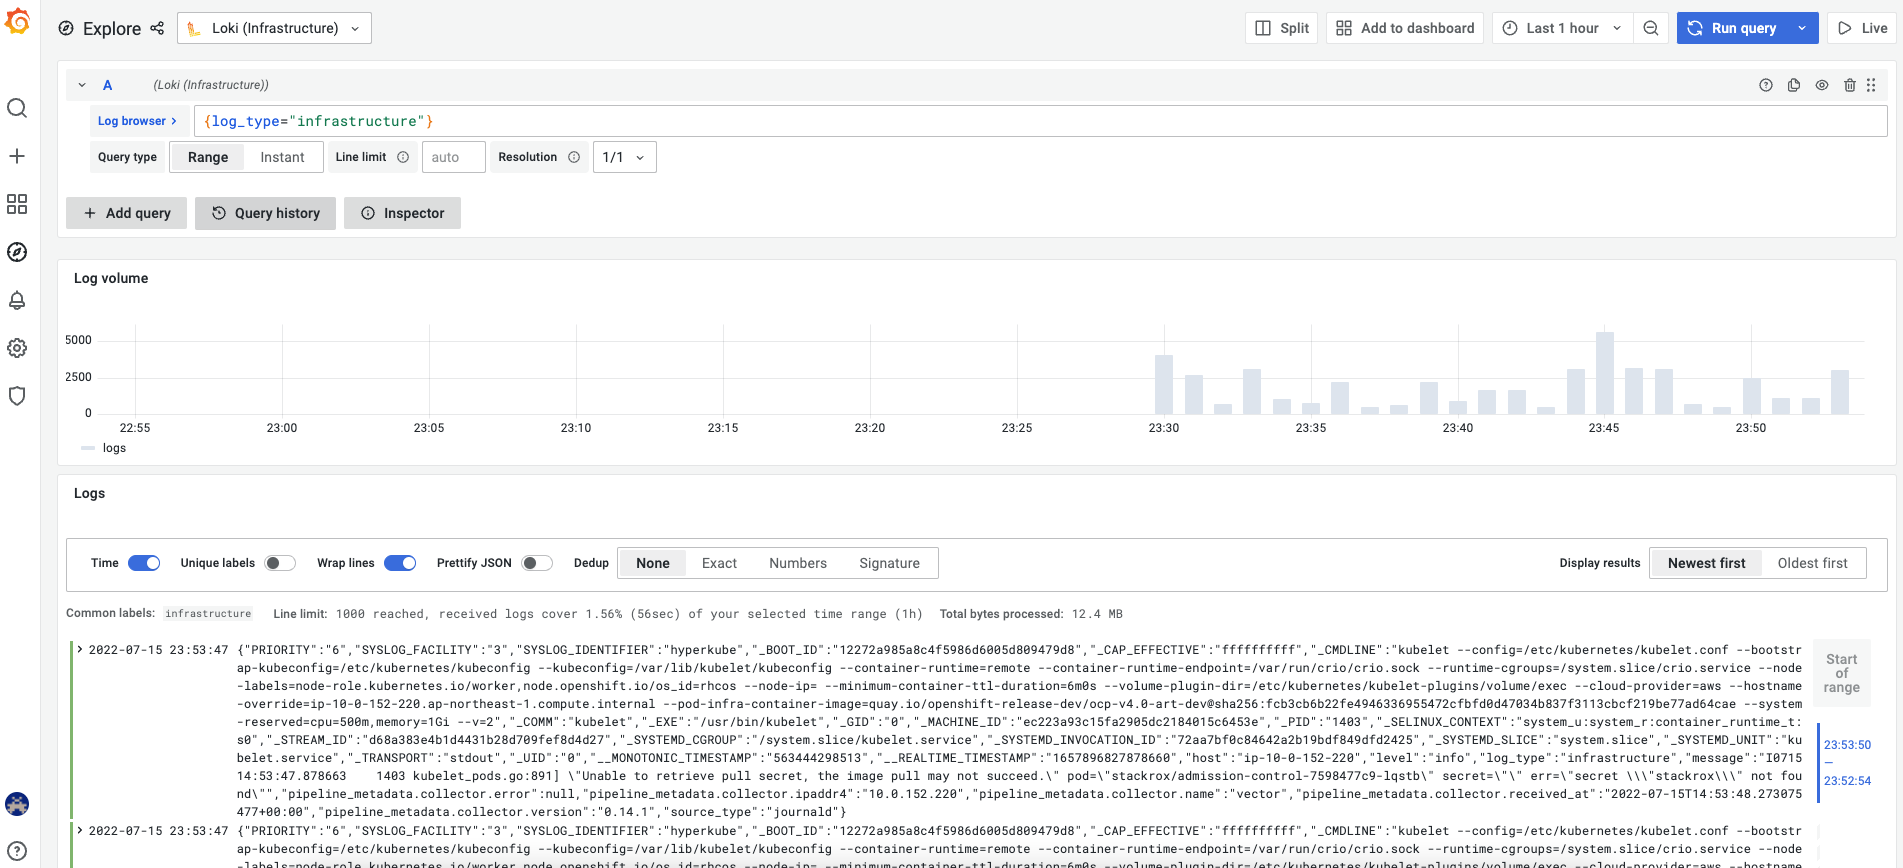
Infrastructureも確認できる
参考
-
OpenShift 4.10 Logging 5.4リリースノート
https://docs.openshift.com/container-platform/4.10/logging/cluster-logging-release-notes.html#cluster-logging-about-vector -
Lokistack
https://loki-operator.dev/docs/hack_operator_make_run.md/#hacking-on-openshift
https://fossies.org/linux/misc/loki-2.6.0.tar.gz:a/loki-2.6.0/operator/hack/deploy-aws-storage-secret.sh
https://fossies.org/linux/misc/loki-2.6.0.tar.gz:a/loki-2.6.0/operator/hack/lokistack_dev.yaml -
ClusterLogging(vector)
https://loki-operator.dev/docs/forwarding_logs_without_gateway.md/#openshift-logging
https://loki-operator.dev/docs/howto_connect_grafana.md/#using-the-gateway-with-openshift-based-authentication -
Grafana
https://loki-operator.dev/docs/howto_connect_grafana.md/
https://fossies.org/linux/loki/operator/hack/addon_grafana_gateway_ocp_oauth.yaml