初めに
私が日常の解析でPycaretで手法選定をしていると
LightGBM、ランダムフォレストが好成績であることがしばしばある
そして、ツリー構造を調べたくなる経験が多い
PyCaretの実行
import numpy as np
import matplotlib.pyplot as plt
import plotly
import pandas as pd
import os
import seaborn as sns

from pycaret.regression import *
from sklearn import preprocessing,linear_model,svm,ensemble
from sklearn.model_selection import GridSearchCV
from sklearn.model_selection import train_test_split,cross_val_score
import warnings
warnings.filterwarnings('ignore')
%matplotlib inline

#データインポート
data_train = pd.read_csv('train.csv')
data_test = pd.read_csv('test.csv')

#pycaret起動
expl=setup(data_train,
           target='MedHouseVal',
           test_data=data_test,
           session_id=1,
           normalize=False,
           transformation=False,
           transform_target=False,
           numeric_features=[],
           ignore_features=['Unnamed: 0']
          )

#モデルの比較
compare_models(sort='rmse',fold=4,n_select=3)
#モデルのパラメータ最適化
lgbm=create_model('lightgbm',fold=4)
tuned_lgbm=tune_model(lgbm,n_iter=100,optimize='rmse',fold=4)
なお、訓練データ、テストデータについては下記の私の記事から作成したので割愛する。
最適化したLightGBMの詳細を知る
上記コードのtuned_lgbmが最適化した変数となっているので
そのまま変数名を入力するだけで詳細がわかる。
tuned_lgbm
実行してみると、scikit-learnのLGBMRegressorが使用されていることがわかる。つまりPycaretが統括して各種クラスを使用して最適化を図っているようだ
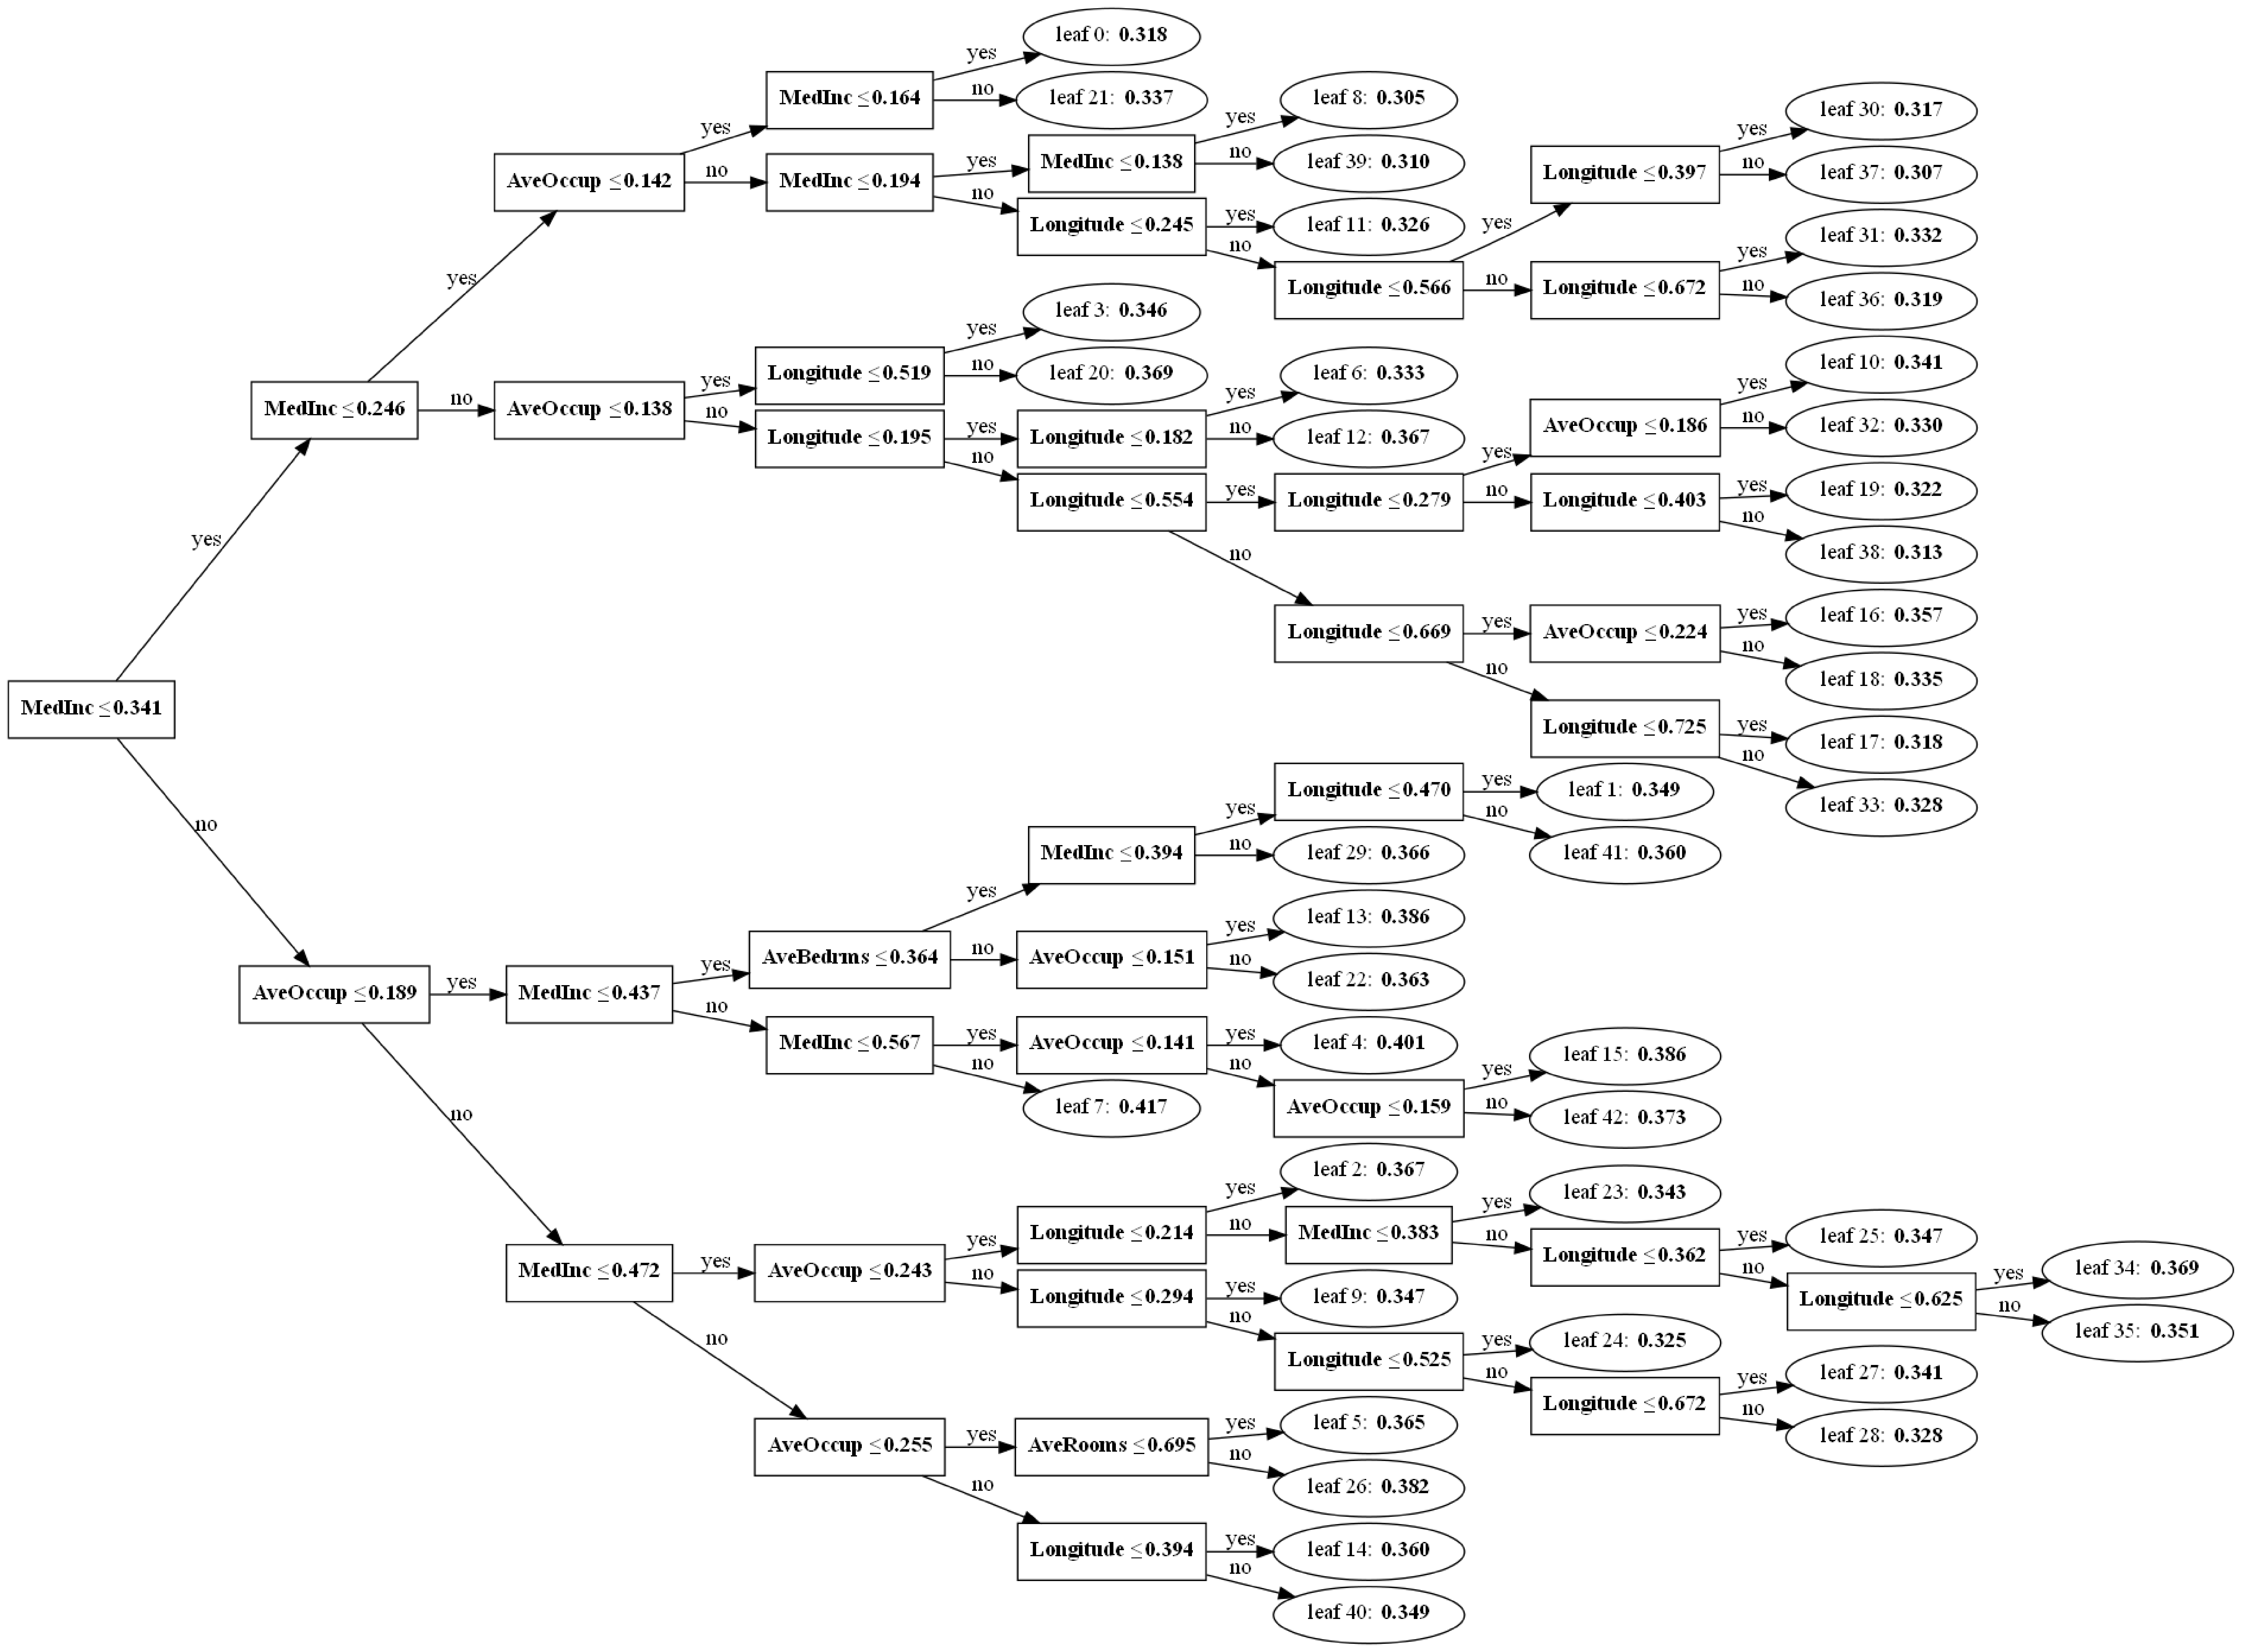
今回のLGBMRegressorはplot_treeで可視化できるので実行してみた

Plot_treeの実行
可視化の前に
graphvizのインストールを忘れずに
Windows+Anaconda環境であればAnaconda Promptで
conda install python-graphviz
C:\Users\ユーザー名*\anaconda3\pkgs\graphviz*\Library\bin
を追加し、リブートすればよい。
(ユーザー名やgraphvizのバージョンは環境で異なるため、ワイルドカード*部は変更すること)
import lightgbm
import graphviz
lightgbm.plot_tree(tuned_lgbm, tree_index=0,figsize=(150, 100));
なお、下記のようにfor文でループさせることで
Leaf-wiseの様子が可視化できると思います。
for i in range(tuned_lgbm.n_estimators):
    lightgbm.plot_tree(tuned_lgbm, tree_index=i,figsize=(150, 100));
最後に
決定木、ランダムフォレストも同様に可視化できますので
解析時にどの因子をどのくらいのThresholdで分類しているのか
理解するときに役立つと思います。
以上 最後までお読みいただきありがとうございました。


