注意
タイトルに MATLAB とあるけど実際は MATLAB のコードは一切出てきません
元ネタは Grayscale to Red-Green-Blue (MATLAB Jet) color scale から。
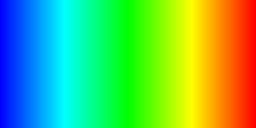
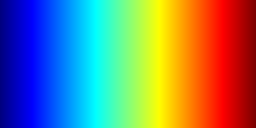
画像出力して比較してみる。結論から言うと以下の表示になる。
hot-to-cold.png の結果 (jet よりマイルド)

画像出力のコードは以下を用いた。stb_image_write.h をダウンロードし、同じディレクトリに配置する必要がある。比較的新しいコンパイラであればコンパイル通るはず (VS2013 で試した)。
# include <cstdint>

# define STB_IMAGE_WRITE_IMPLEMENTATION
# include "stb_image_write.h"

namespace {

/* code from http://stackoverflow.com/a/7811134 */

typedef struct {
    double r,g,b;
} COLOUR;

COLOUR GetColour(double v,double vmin,double vmax)
{
    COLOUR c = {1.0,1.0,1.0}; // white
    double dv;

    if (v < vmin)
        v = vmin;
    if (v > vmax)
        v = vmax;
    dv = vmax - vmin;

    if (v < (vmin + 0.25 * dv)) {
        c.r = 0;
        c.g = 4 * (v - vmin) / dv;
    } else if (v < (vmin + 0.5 * dv)) {
        c.r = 0;
        c.b = 1 + 4 * (vmin + 0.25 * dv - v) / dv;
    } else if (v < (vmin + 0.75 * dv)) {
        c.r = 4 * (v - vmin - 0.5 * dv) / dv;
        c.b = 0;
    } else {
        c.g = 1 + 4 * (vmin + 0.75 * dv - v) / dv;
        c.b = 0;
    }

    return(c);
}

/* code from http://stackoverflow.com/a/7706668 */

double interpolate( double val, double y0, double x0, double y1, double x1 ) {
    return (val-x0)*(y1-y0)/(x1-x0) + y0;
}

double base( double val ) {
    if ( val <= -0.75 ) return 0;
    else if ( val <= -0.25 ) return interpolate( val, 0.0, -0.75, 1.0, -0.25 );
    else if ( val <= 0.25 ) return 1.0;
    else if ( val <= 0.75 ) return interpolate( val, 1.0, 0.25, 0.0, 0.75 );
    else return 0.0;
}

double red( double gray ) {
    return base( gray - 0.5 );
}
double green( double gray ) {
    return base( gray );
}
double blue( double gray ) {
    return base( gray + 0.5 );
}

} /* anonymous namespace */

int main()
{
    static const int width = 256;
    static const int height = 128;
    static const int components = 4;
    static const int stride = width * components;
    uint8_t buffer[width * height * components];
    for (int i = 0; i < width; i++) {
        const float max = width - 1.0f;
        COLOUR c = GetColour(i / max, 0.0f, 1.0f);
        for (int j = 0; j < height; j++) {
            int offset = i * components + j * stride;
            buffer[offset + 0] = uint8_t(c.r * 0xff);
            buffer[offset + 1] = uint8_t(c.g * 0xff);
            buffer[offset + 2] = uint8_t(c.b * 0xff);
            buffer[offset + 3] = 0xff;
        }
    }
    stbi_write_png("hot-to-cold.png", width, height, components, buffer, stride);
    for (int i = 0; i < width; i++) {
        const float max = (width * 0.5f) - 1.0f;
        const float gray = (i - max) / max;
        for (int j = 0; j < height; j++) {
            int offset = i * components + j * stride;
            buffer[offset + 0] = uint8_t(red(gray) * 0xff);
            buffer[offset + 1] = uint8_t(green(gray) * 0xff);
            buffer[offset + 2] = uint8_t(blue(gray) * 0xff);
            buffer[offset + 3] = 0xff;
        }
    }
    stbi_write_png("jet.png", width, height, components, buffer, stride);
    return 0;
}
ちなみにオープンソースのライブラリである libigl (MPL) にも jet という関数があり、Eigen との組み合わせで使うならそちらのほうが便利かもしれない。
2015/5/25 追記 (5/30 更新)
別の選択肢として GLSL のシェーダ実装と C++ の実装の両方が入ってる glsl-colormap がある。こちらのほうが種類が豊富で MATLAB の Jet やその他のカラーマップ、gnuplot や transform 形式にも対応している。
